AWS SiteWise
Empowering humans to operate their equipment better
01/21/2021
I joined Amazon Web Services in September 2019 on the nascent IoT team. We were working on an idea for a cloud HMI solution for industrial IoT. When I joined, the idea was still simply paragraphs on paper. I was tasked with creating, defining, and envisioning what the experience for such an application would be.
I have omitted confidential information in this case study. All information in this case study is either public knowledge or are-imagination of my own and does not necessarily reflect the views of Amazon.

AWS SiteWise
Launching an app for industrial IoT from scratch
01/21/2021
I have omitted confidential information in this case study. All information in this case study is either public knowledge or are a re-imagination of my own and does not necessarily reflect the views of Amazon.
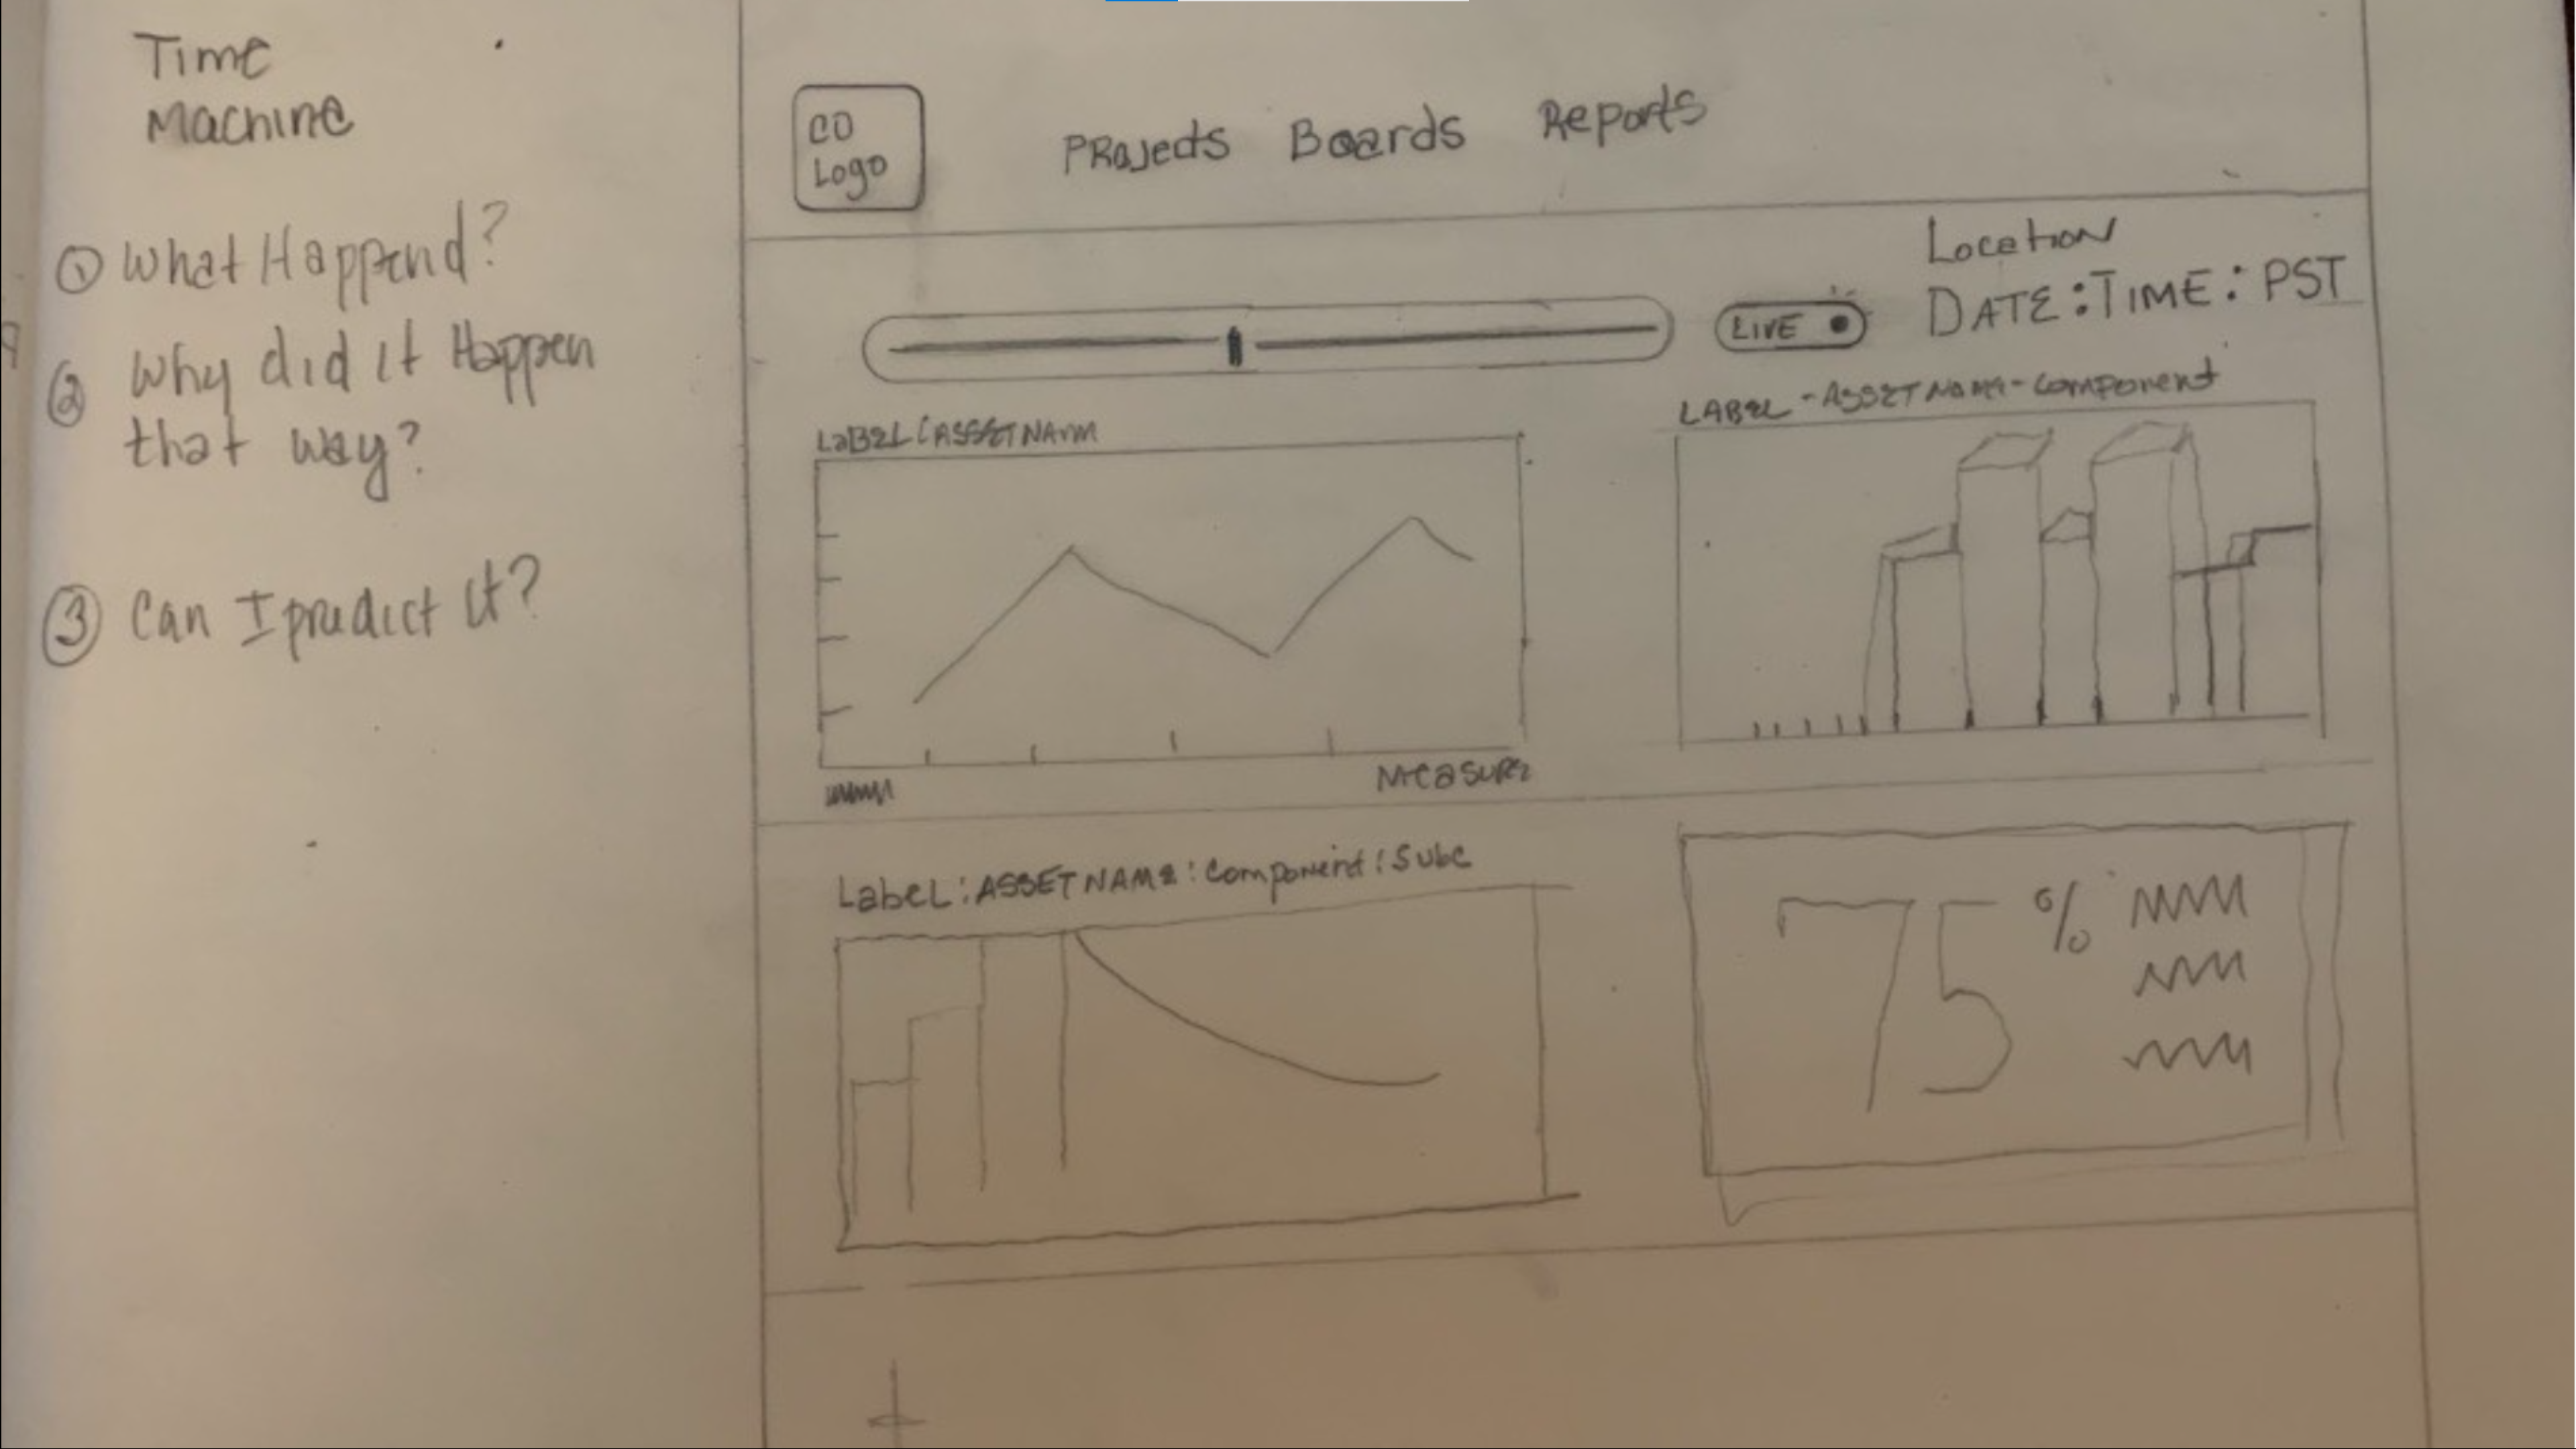
What if you knew the state of every asset at any time?
Industrial operations have long been trying to find ways to improve their operational efficiency. From Toyota's lean manufacturing methods to total quality management, there are many ways to optimize.
For our customers, there were three main concerns: monitoring the current status of their machines, and performing root cause analyses to understand why things went wrong, and getting predictive insights to be able to act preemptively for the future.
I joined Amazon Web Services in September 2019 on the nascent IoT team. We were working on an idea for a cloud HMI solution for industrial IoT. When I joined, the idea was still simply paragraphs on paper. I was tasked with creating, defining, and envisioning what the experience for such an application would be.
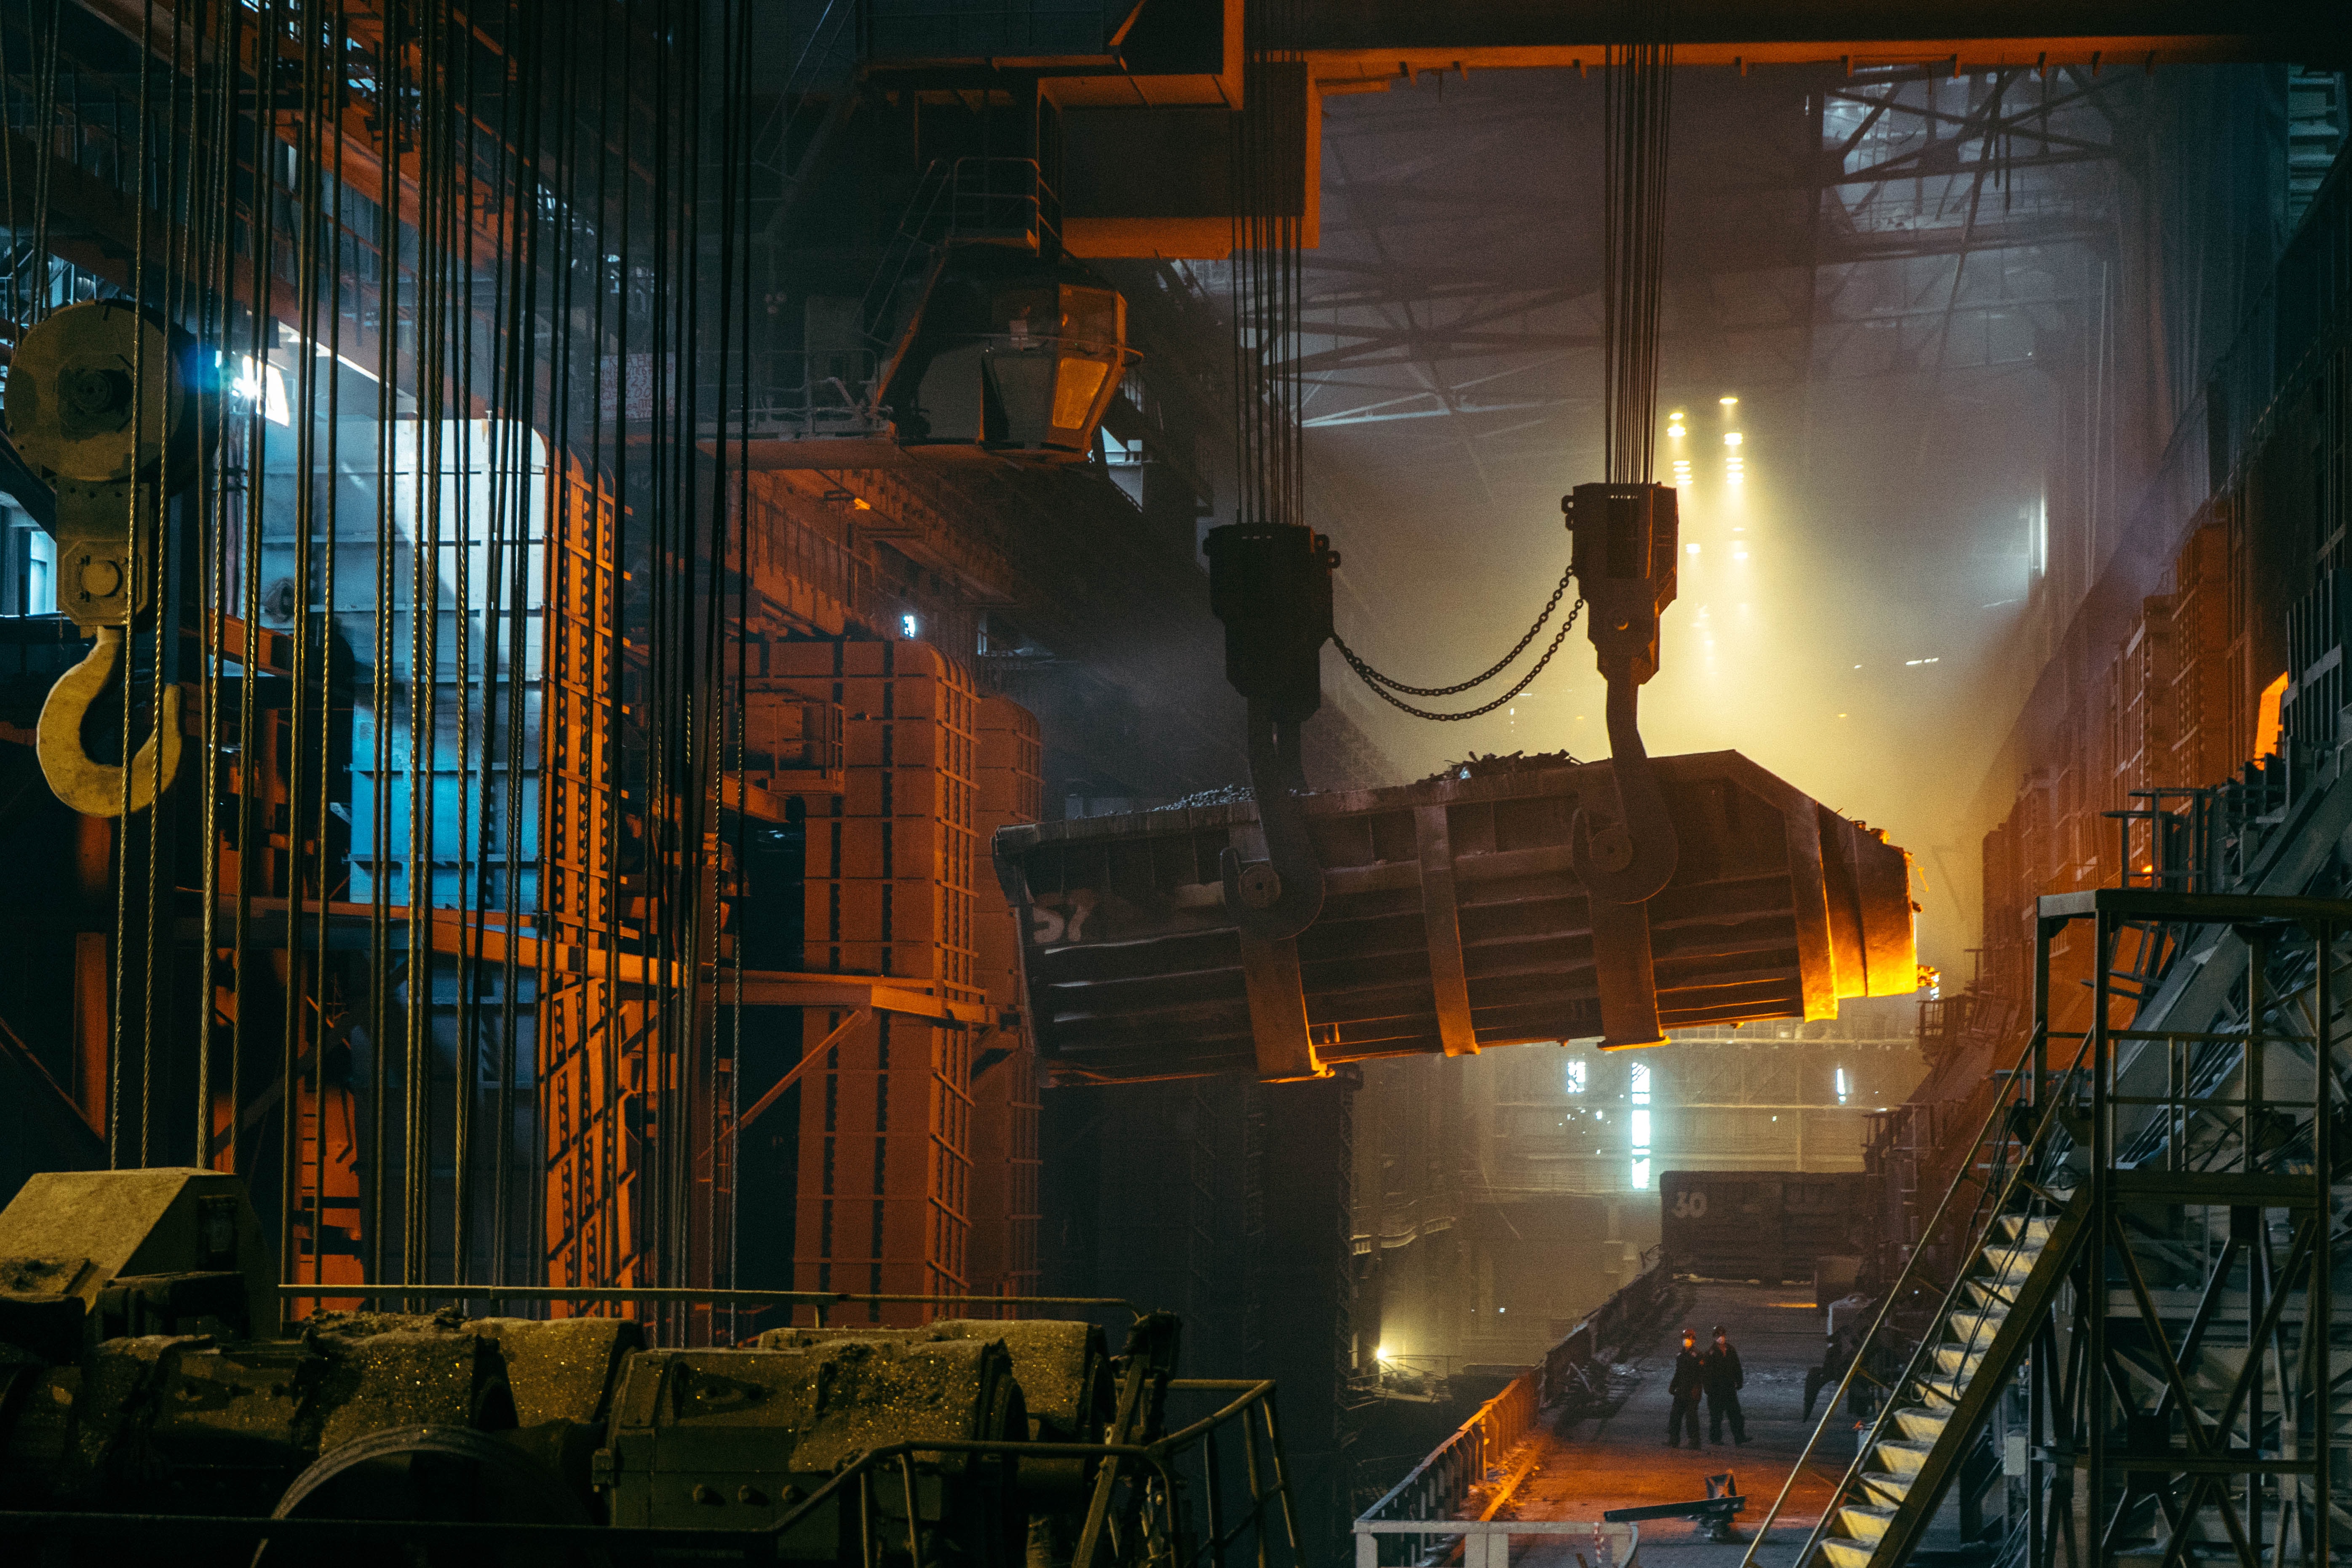
My first course of action was executing gemba, in true Toyota Way, going to the actual site and location to better understand how things worked.
User Insights
We gathered the following key insights:
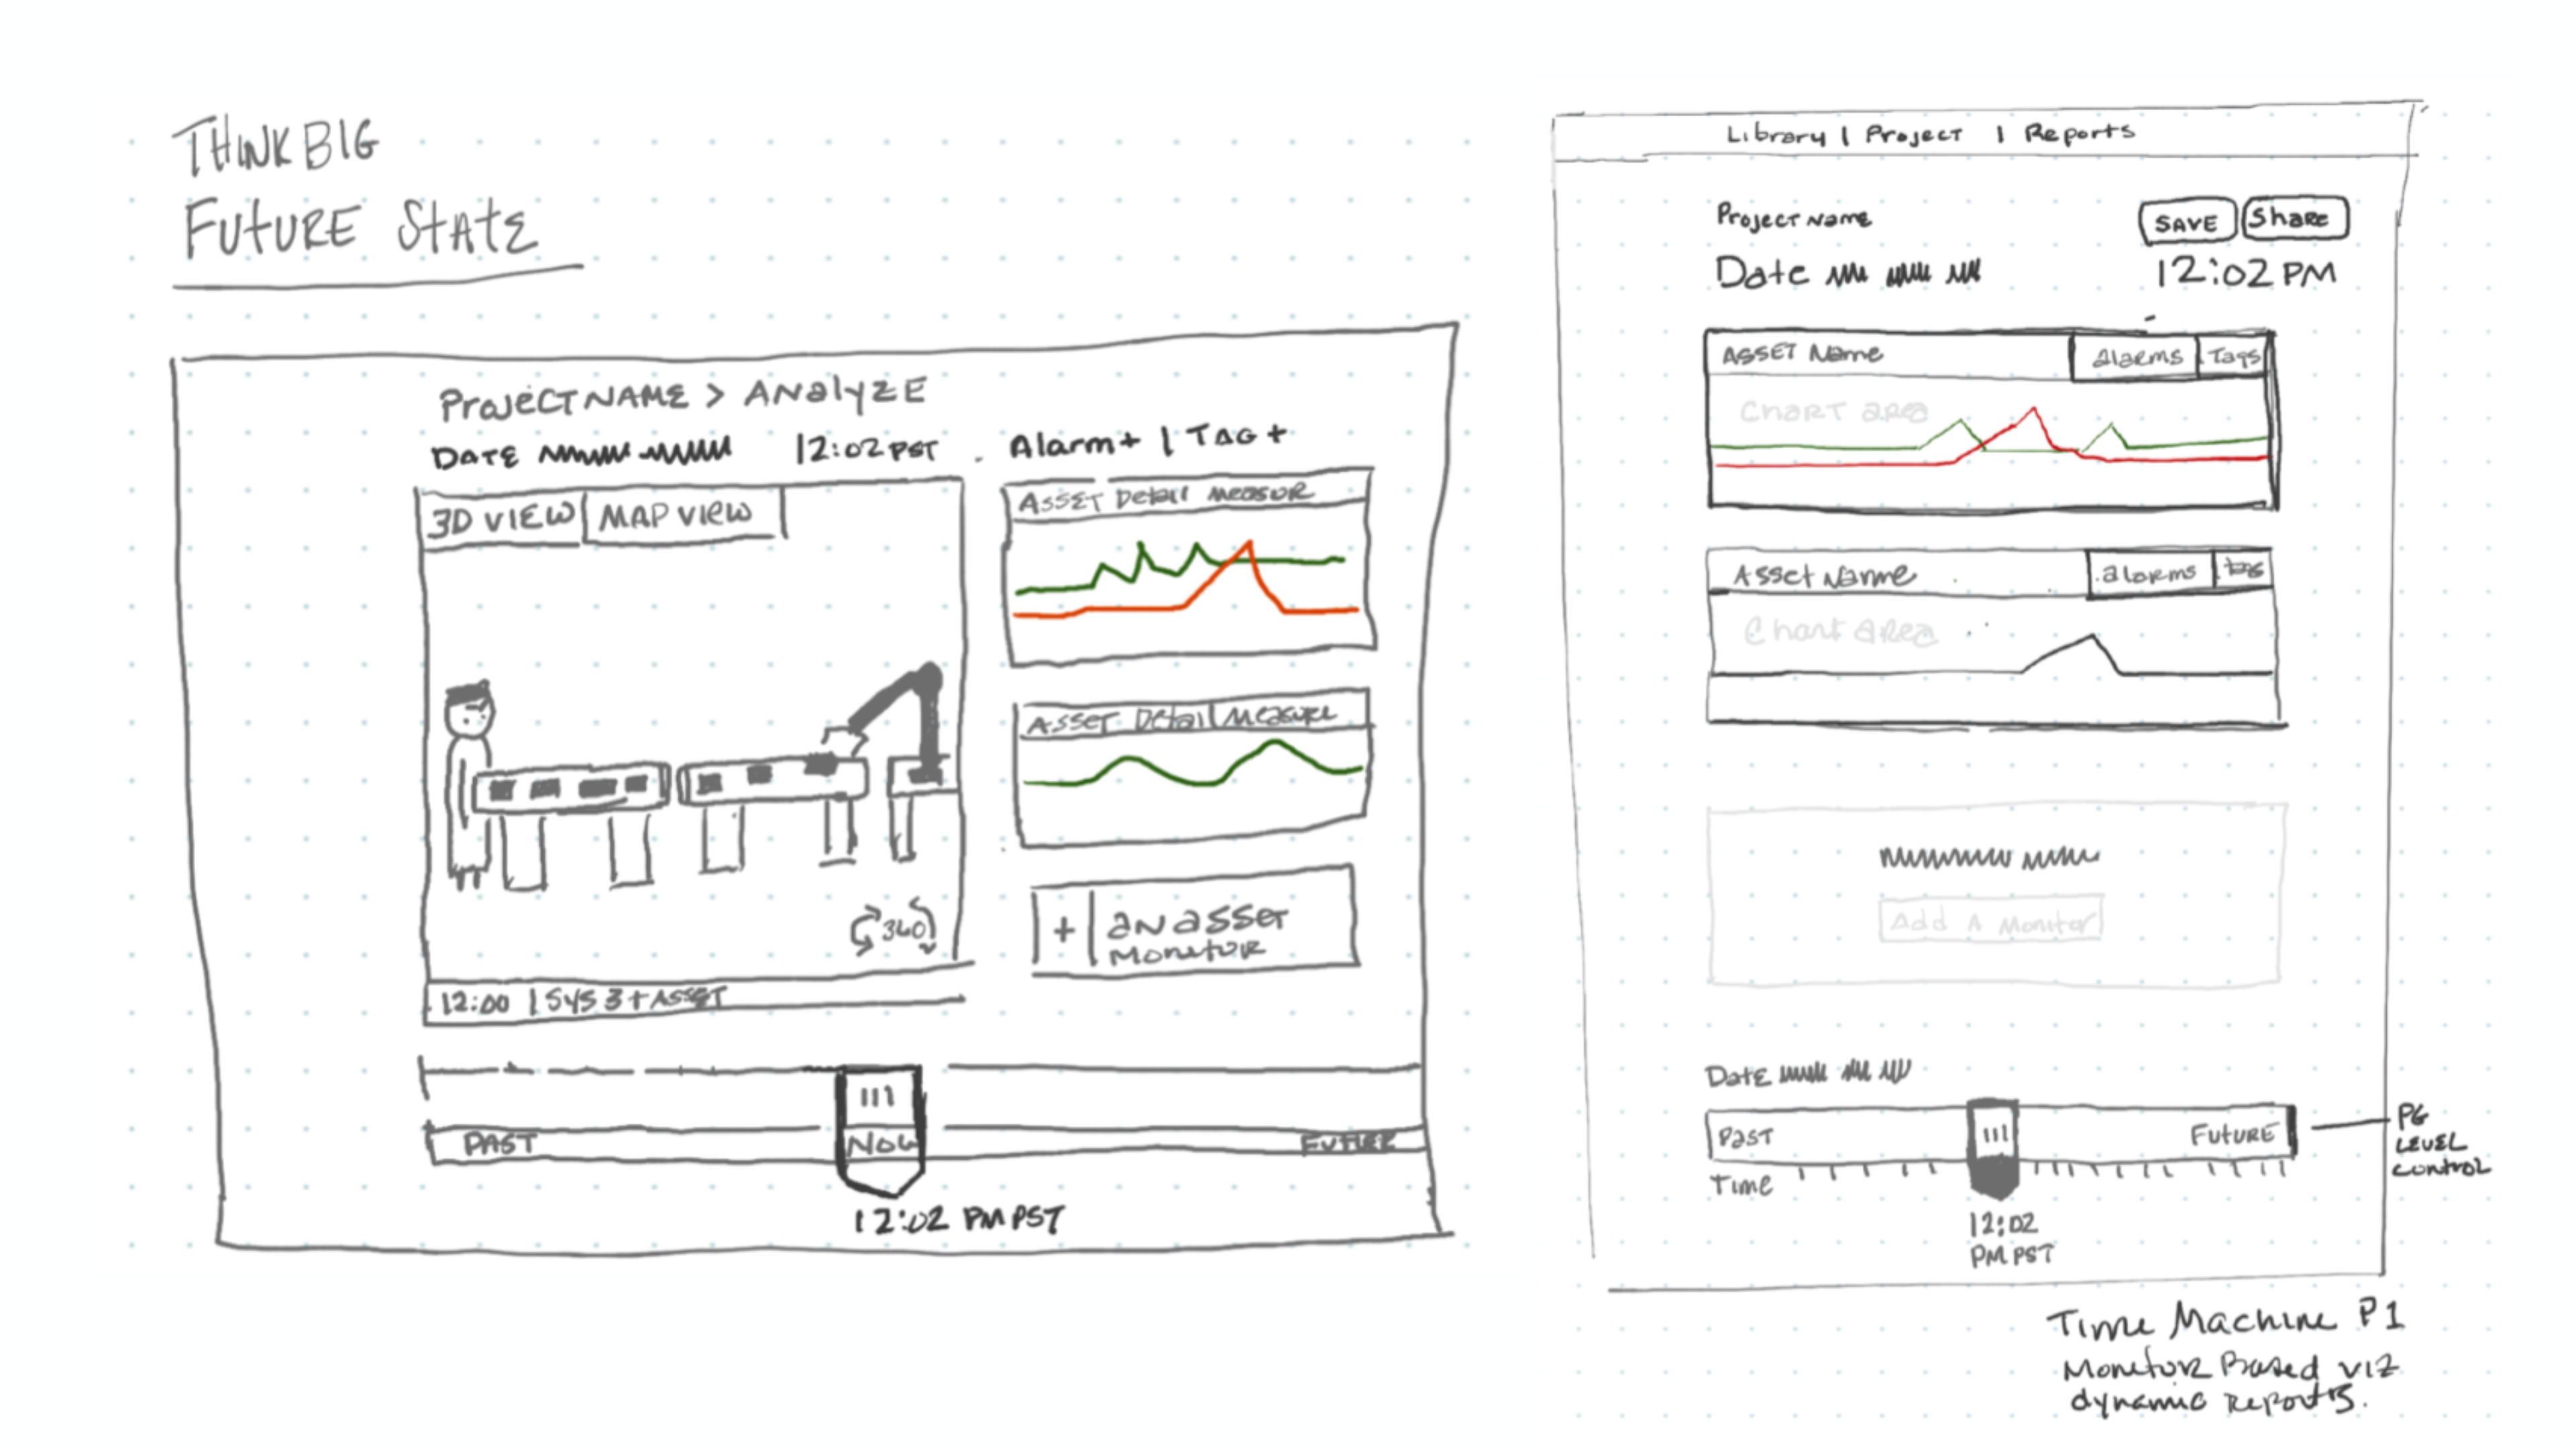
Analyze the Past
What went wrong? Root cause analysis.
Monitor the Now
What is the current health of my machines? Operations dashboards.
Predict the Future
How can I know ahead of time what things might break? Machine learning insights.
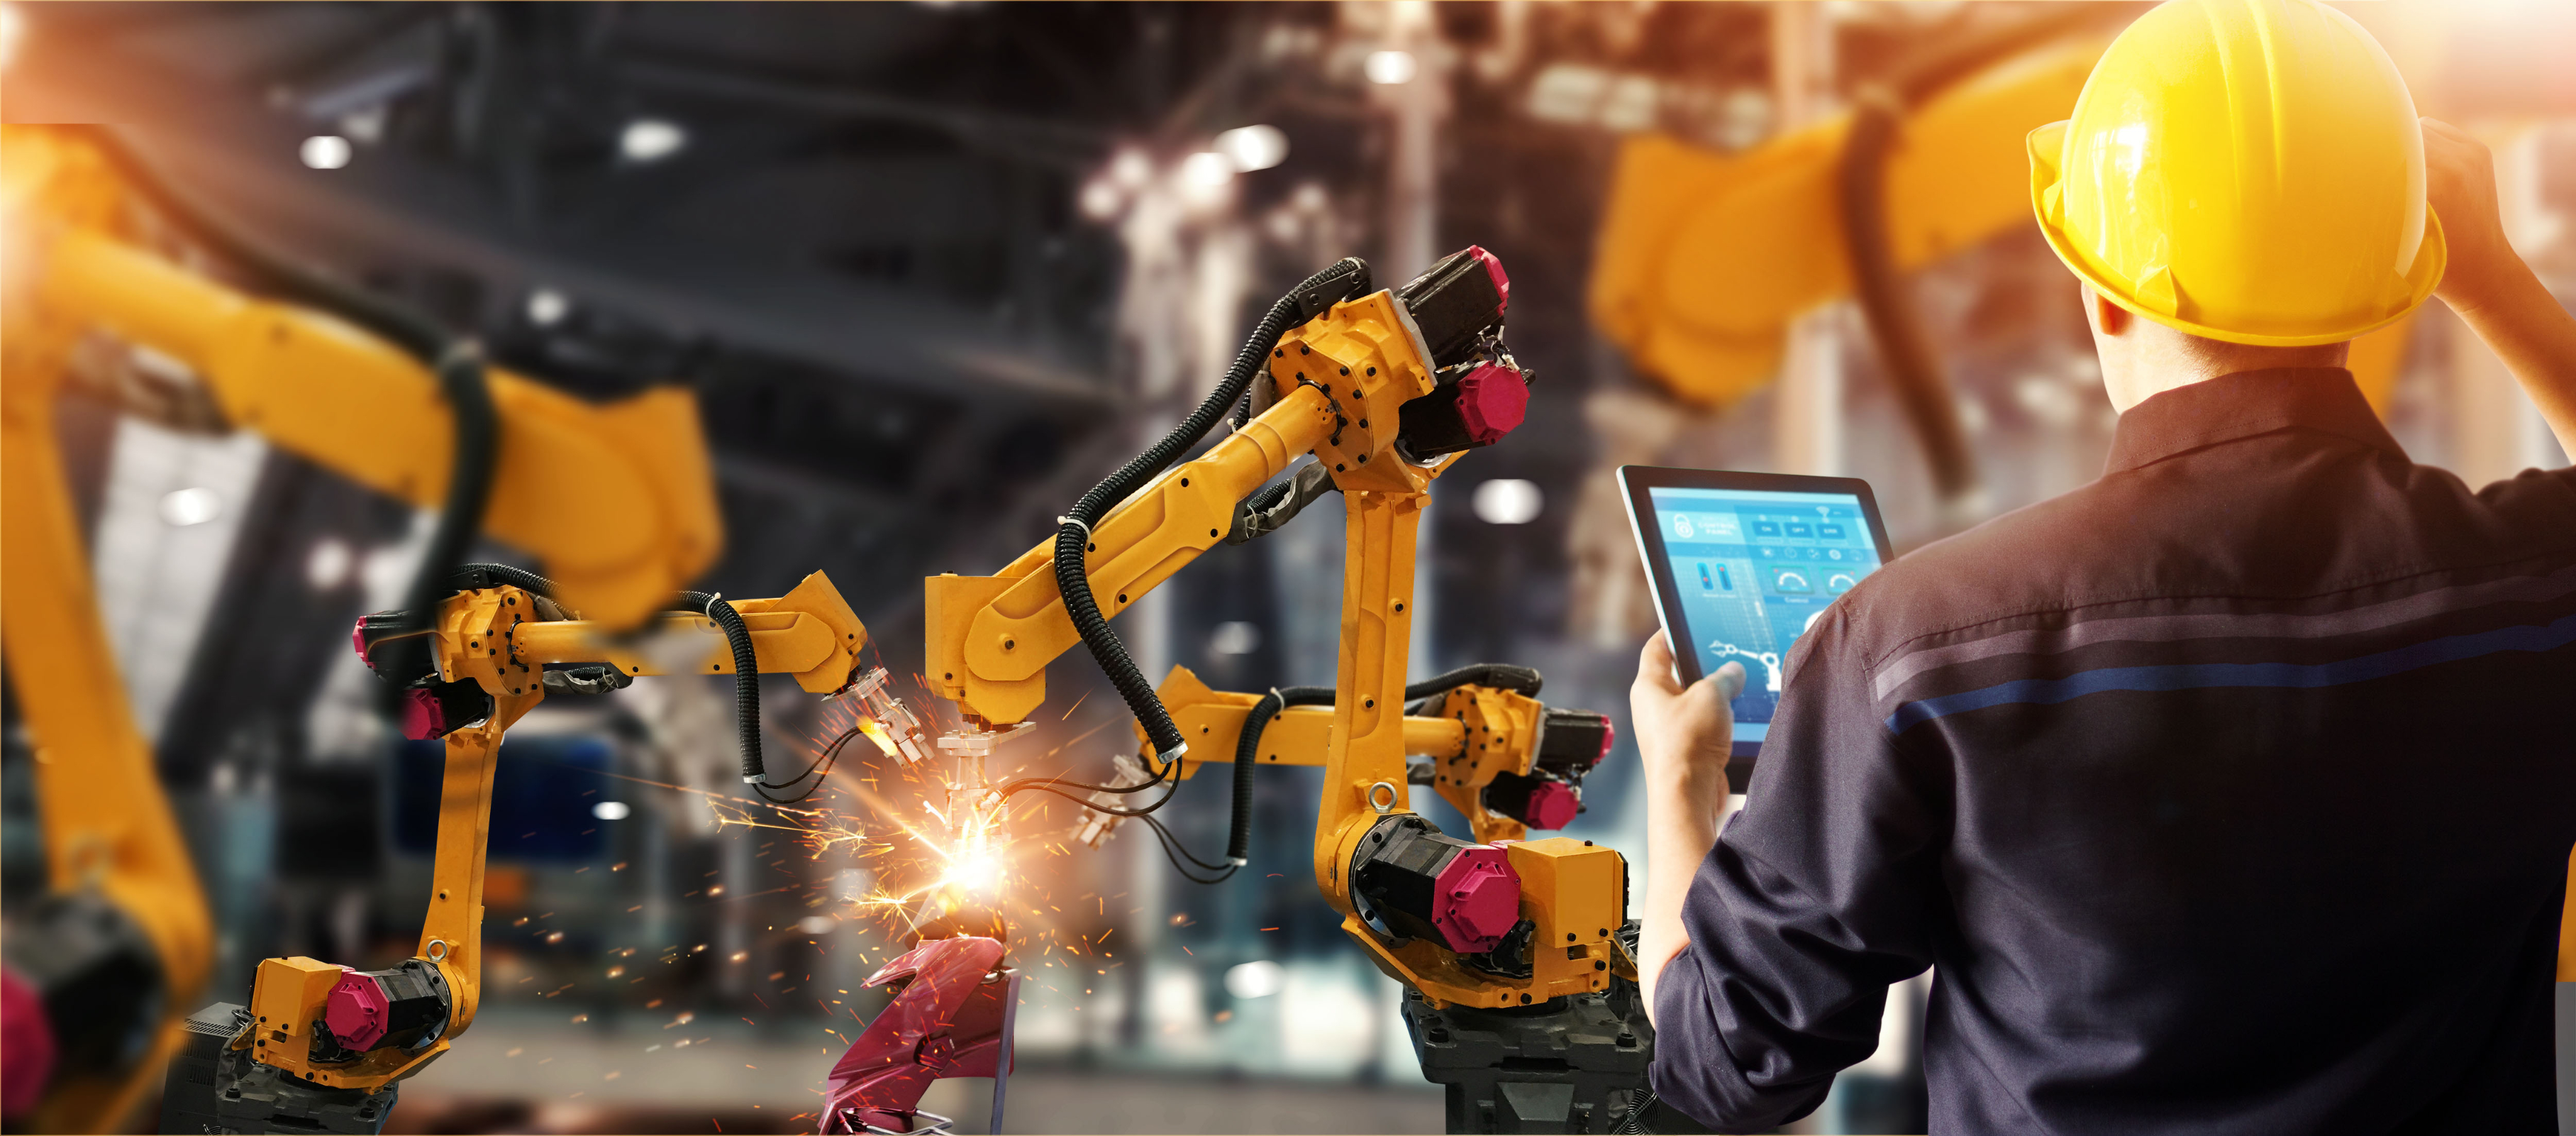
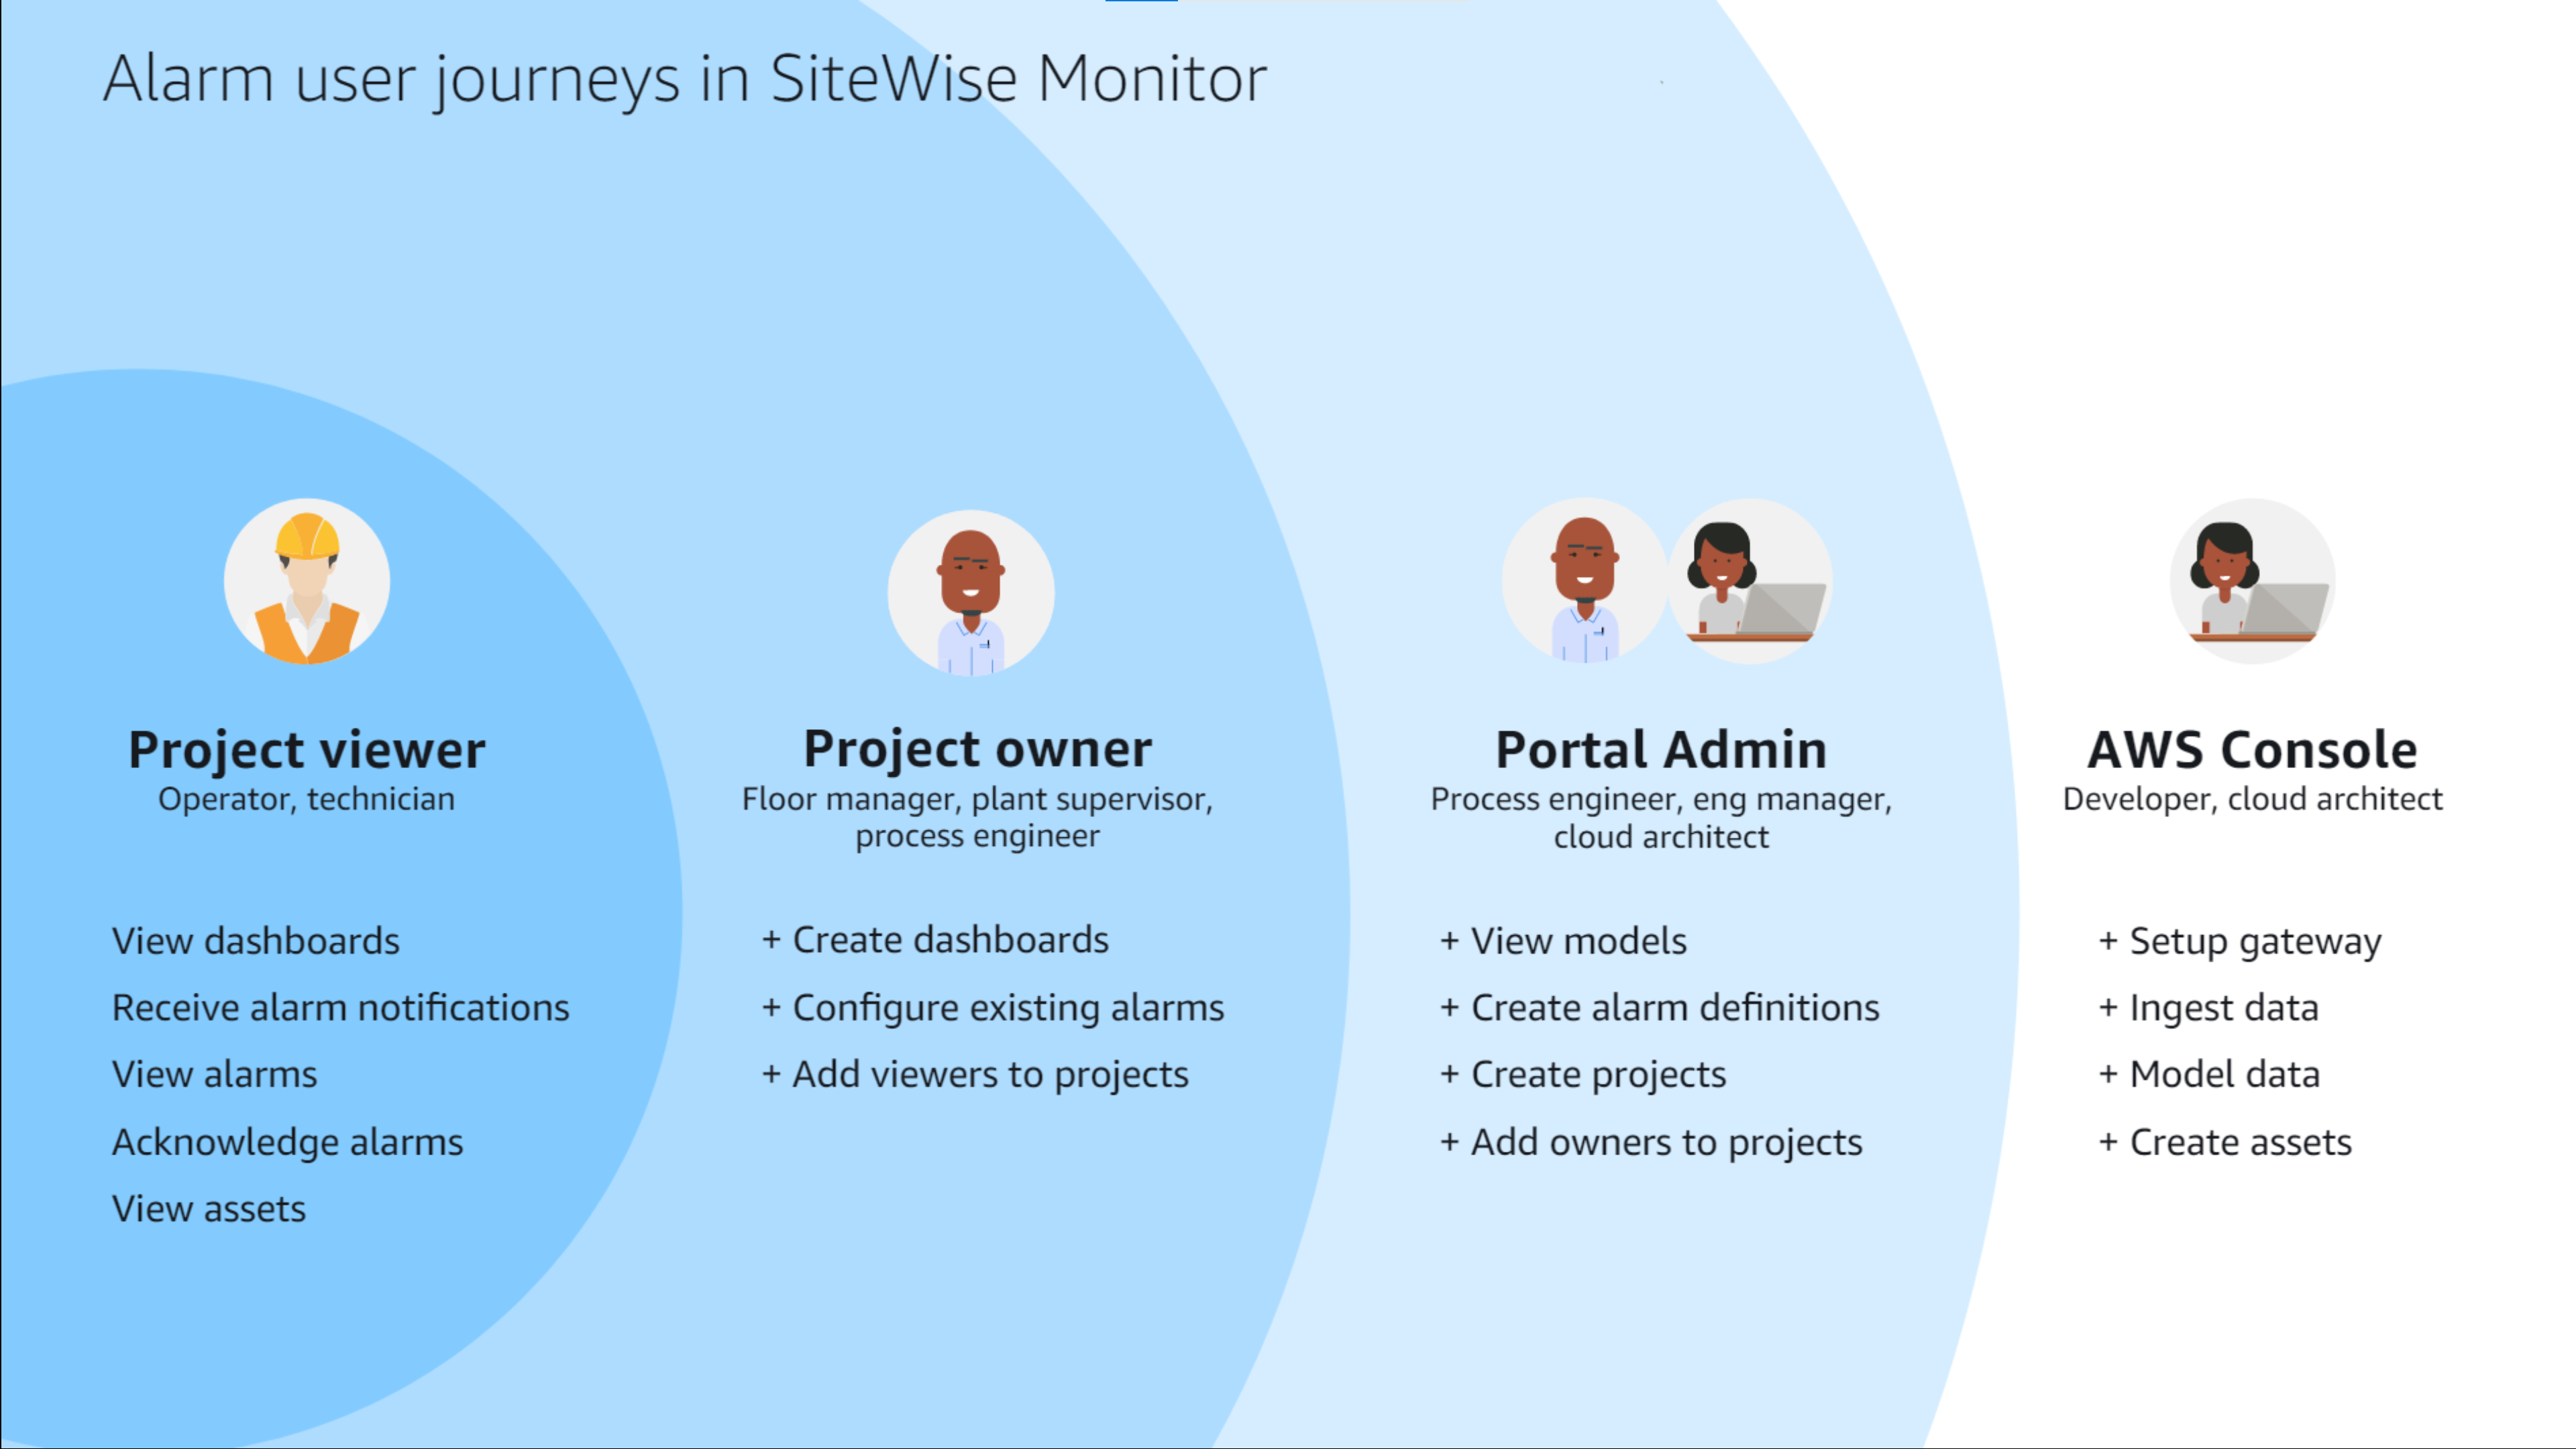
OT needs the Tech
Machine operators, floor managers, and process engineers are in charge of improving day to day operations, and often do not have coding expertise.
IT Sets it Up
Developers, IT admins set up the infrastructure and often build custom applications and solutions for the Operations teams onsite to use.
Range of Tech Maturity
There was a huge range of tech maturity. Some already had very robust on premises IT systems, while others were still recording hourly data with pen and paper.
Ingest
With IoT, the goal was to get their data up into the cloud, where they could then leverage the range of tools AWS has to offer around big data analytics and storage. The first step was to record the measurements off the machines, such as a temperature of a water tank or pressure of a pump with IoT sensors, that would transmit the data to a gateway (router), which would ultimately sync into the cloud. Some companies already had on premise solutions involving a historian. When I joined, AWS had already worked on a service designed to upload data from historians into the AWS cloud, and which could then be modelled and cleaned to be used.
Model
Once the data has been uploaded to the cloud, you could already model it with SiteWise Console, assign tags, and give meaning to the unmodeled ingestion.
Monitor
Now that the data is modelled and human readable, there was no way to visually see and understand the data other than querying a database. This is where I came in to create an application to help monitor your operations.
Analyze
Ultimately, we found that our operations team wanted to be able to perform different kinds of light analysis as well, mainly around root cause when something goes wrong, and predictive maintenance to know when they would need to replace a part or a machine in the future.
Tenets
Self service
Enable operation teams to monitor and analyze their machines without the need to involve IT. Process engineers who were less data-savvy had a harder time understanding jargon such as “interpolation”, “resolution”, “model”, “node”, etc.No code
Operations folks are skilled with hammers, not IDEs. The non-developer user resonated with UI interactions for dragging properties onto the dashboard to visualize them, using the scrubber and chart gestures. Point and click, GUI drivenSeeing is believing
A graph is worth a thousand data queries. Data visualizations would be key to helping operators understand and interpret their data to improve their operations.Augment, don't replace
No black box computations, don't do any "machine learning magic". Earn trust by clearly indicating if the data was raw or aggregated, live or historical to avoid forcing users to make assumptions and guesses.Initial concepts
Abstractions of Visualizations
I created a framework of mapping progressively higher fidelity visualizations to use cases:
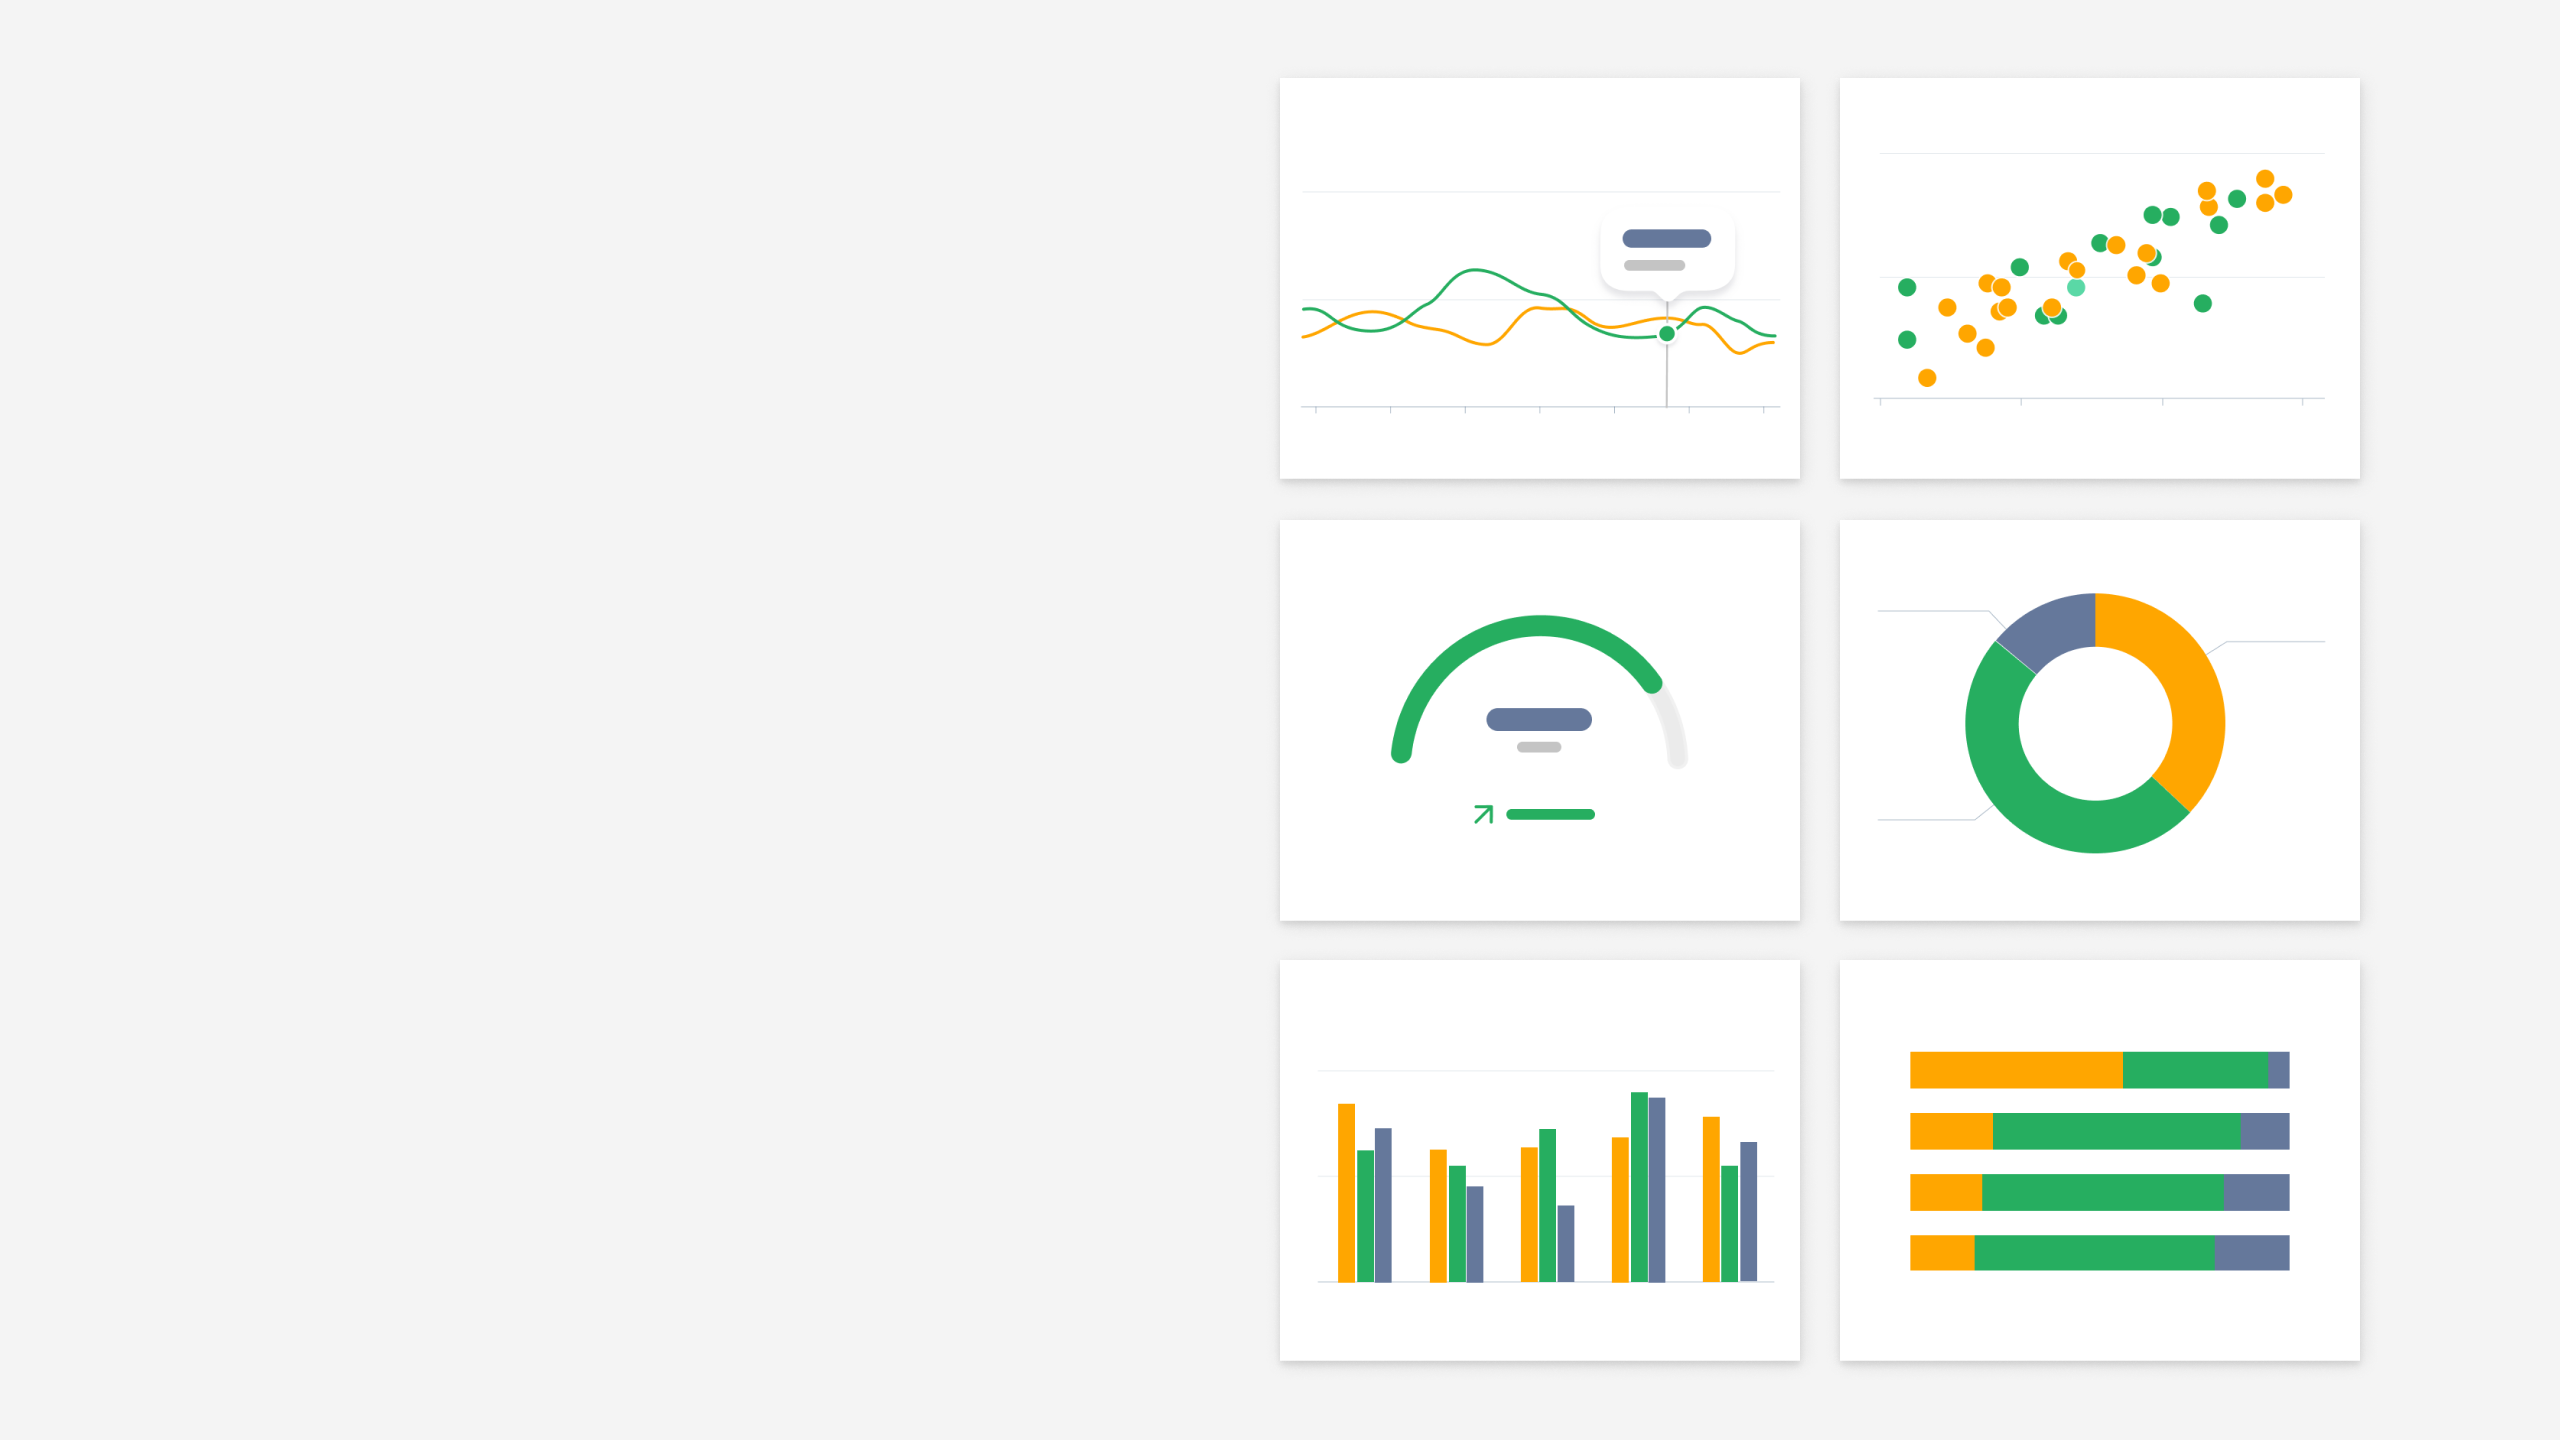
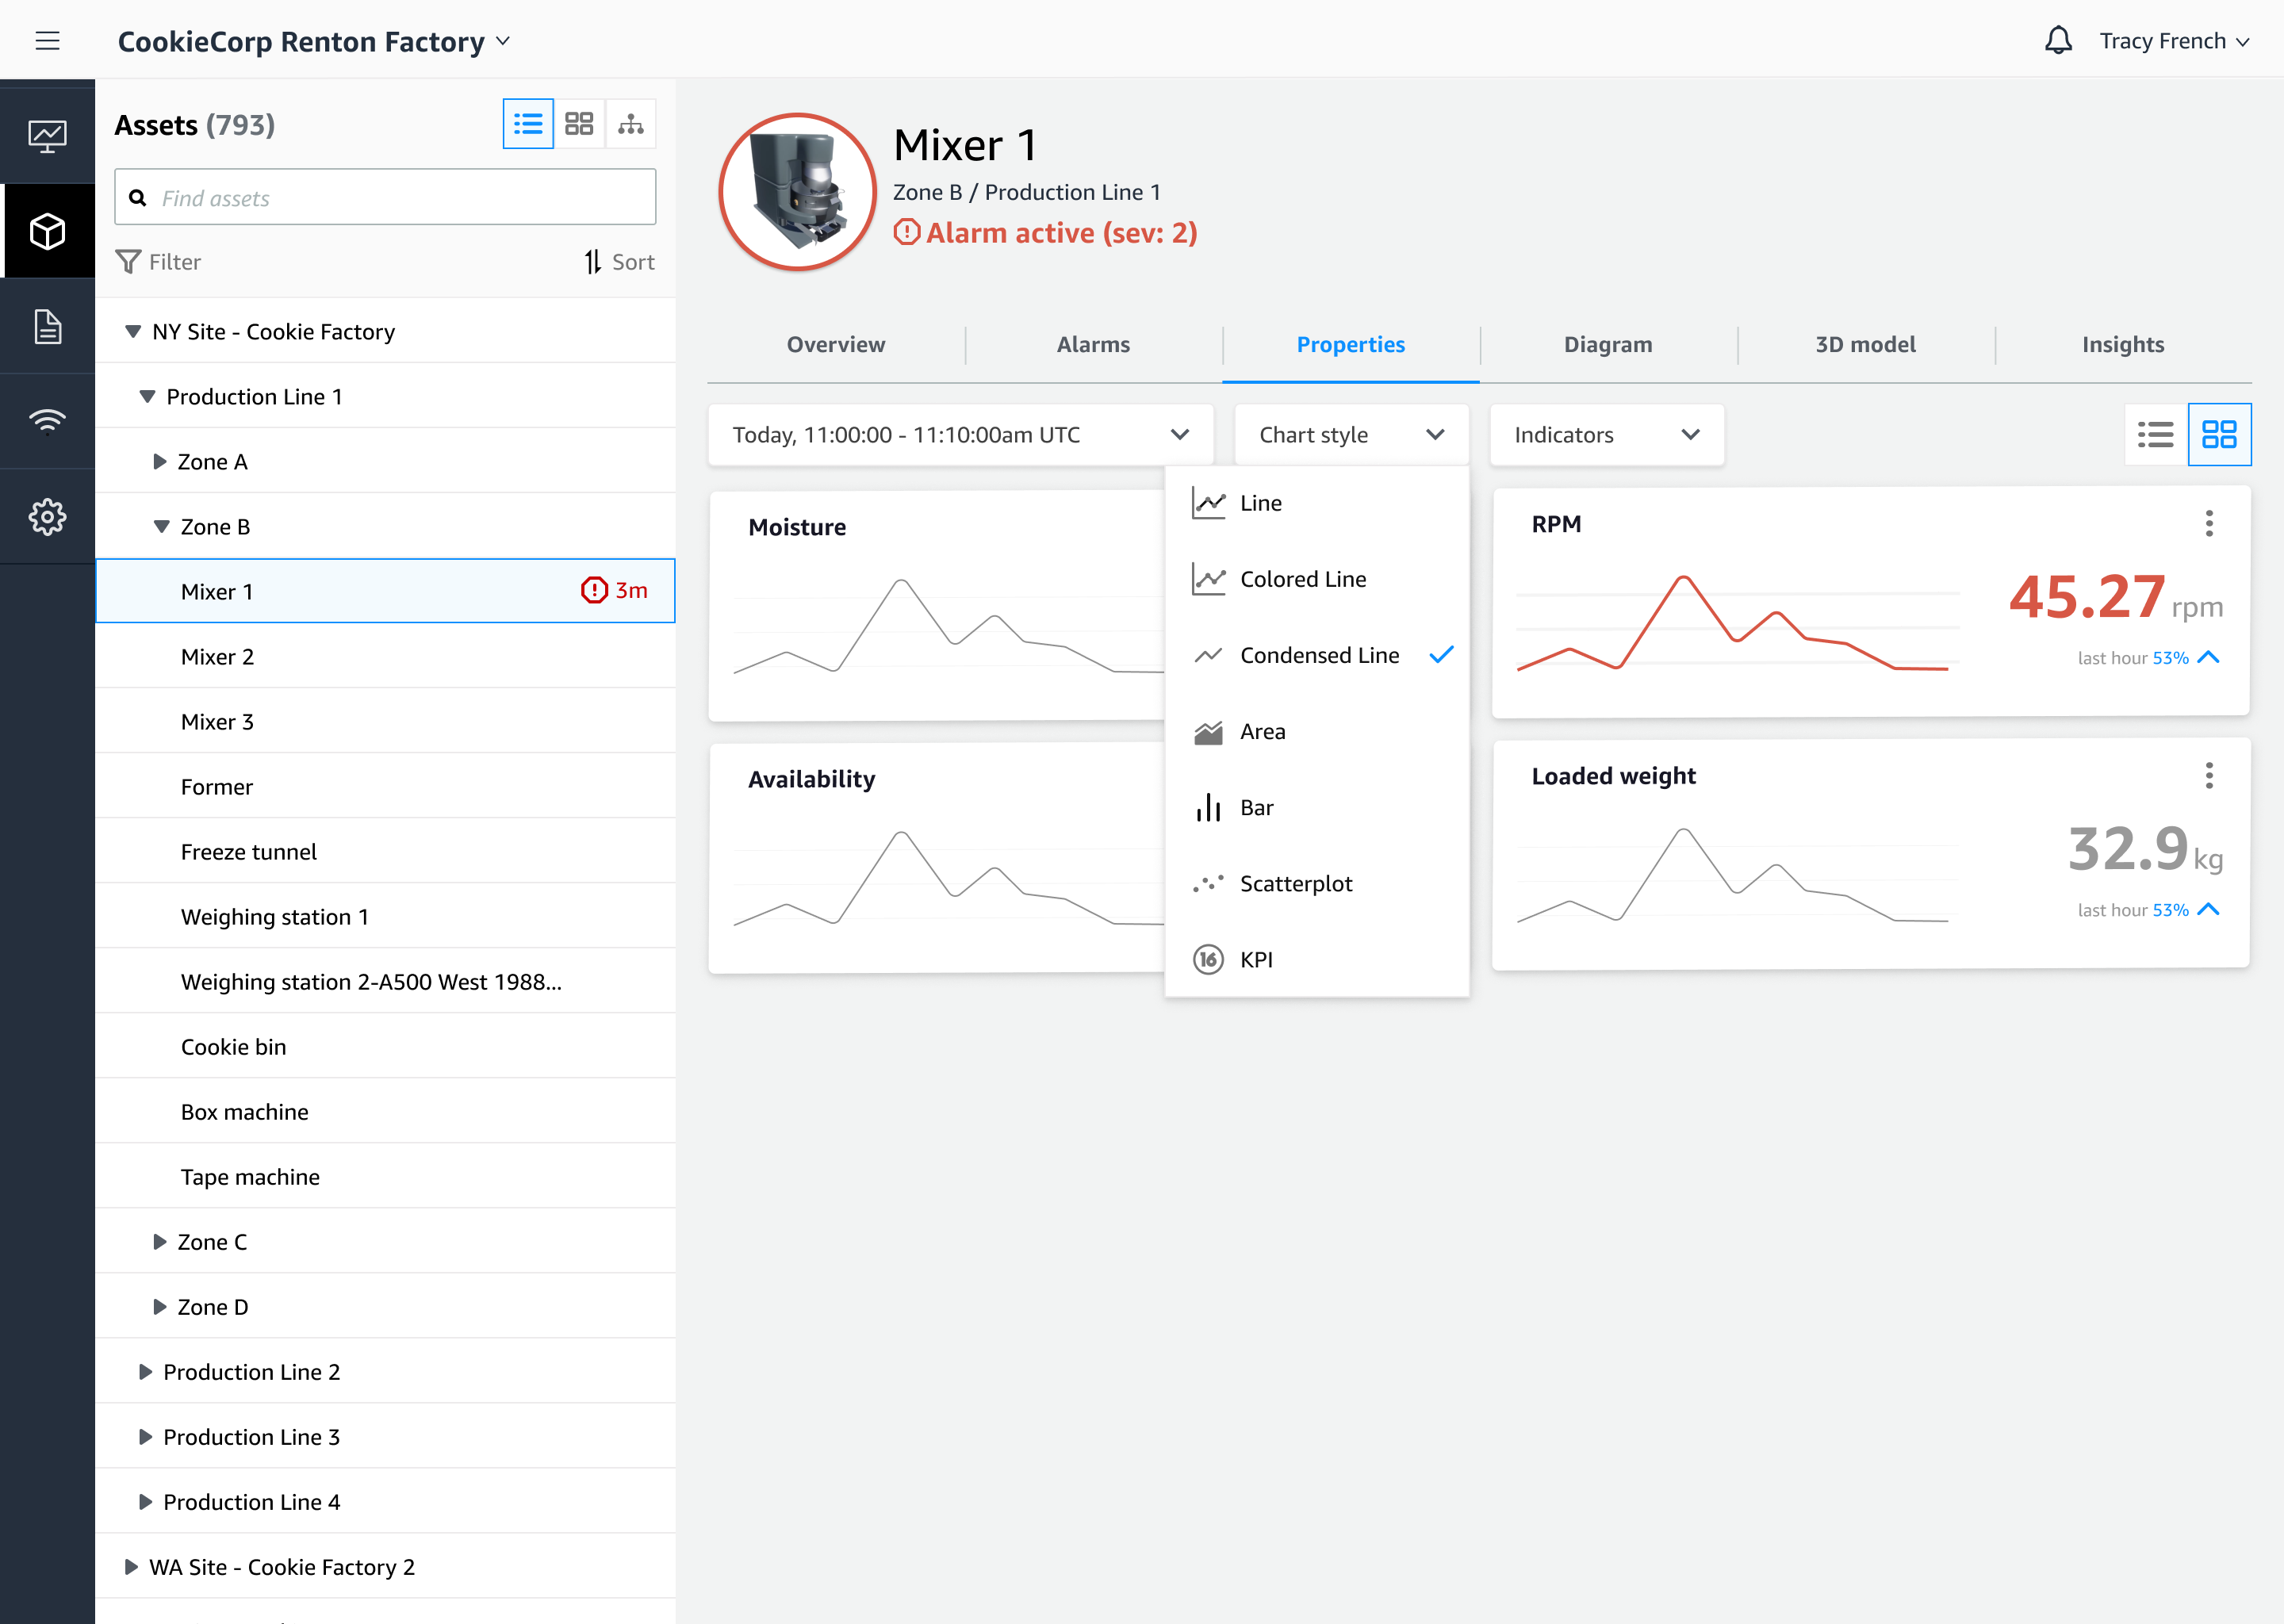
Charts
Monitoring, Quantitative analysis, Thresholds
The first level of data visualization is the most abstract, data-only representation of their measurement values.
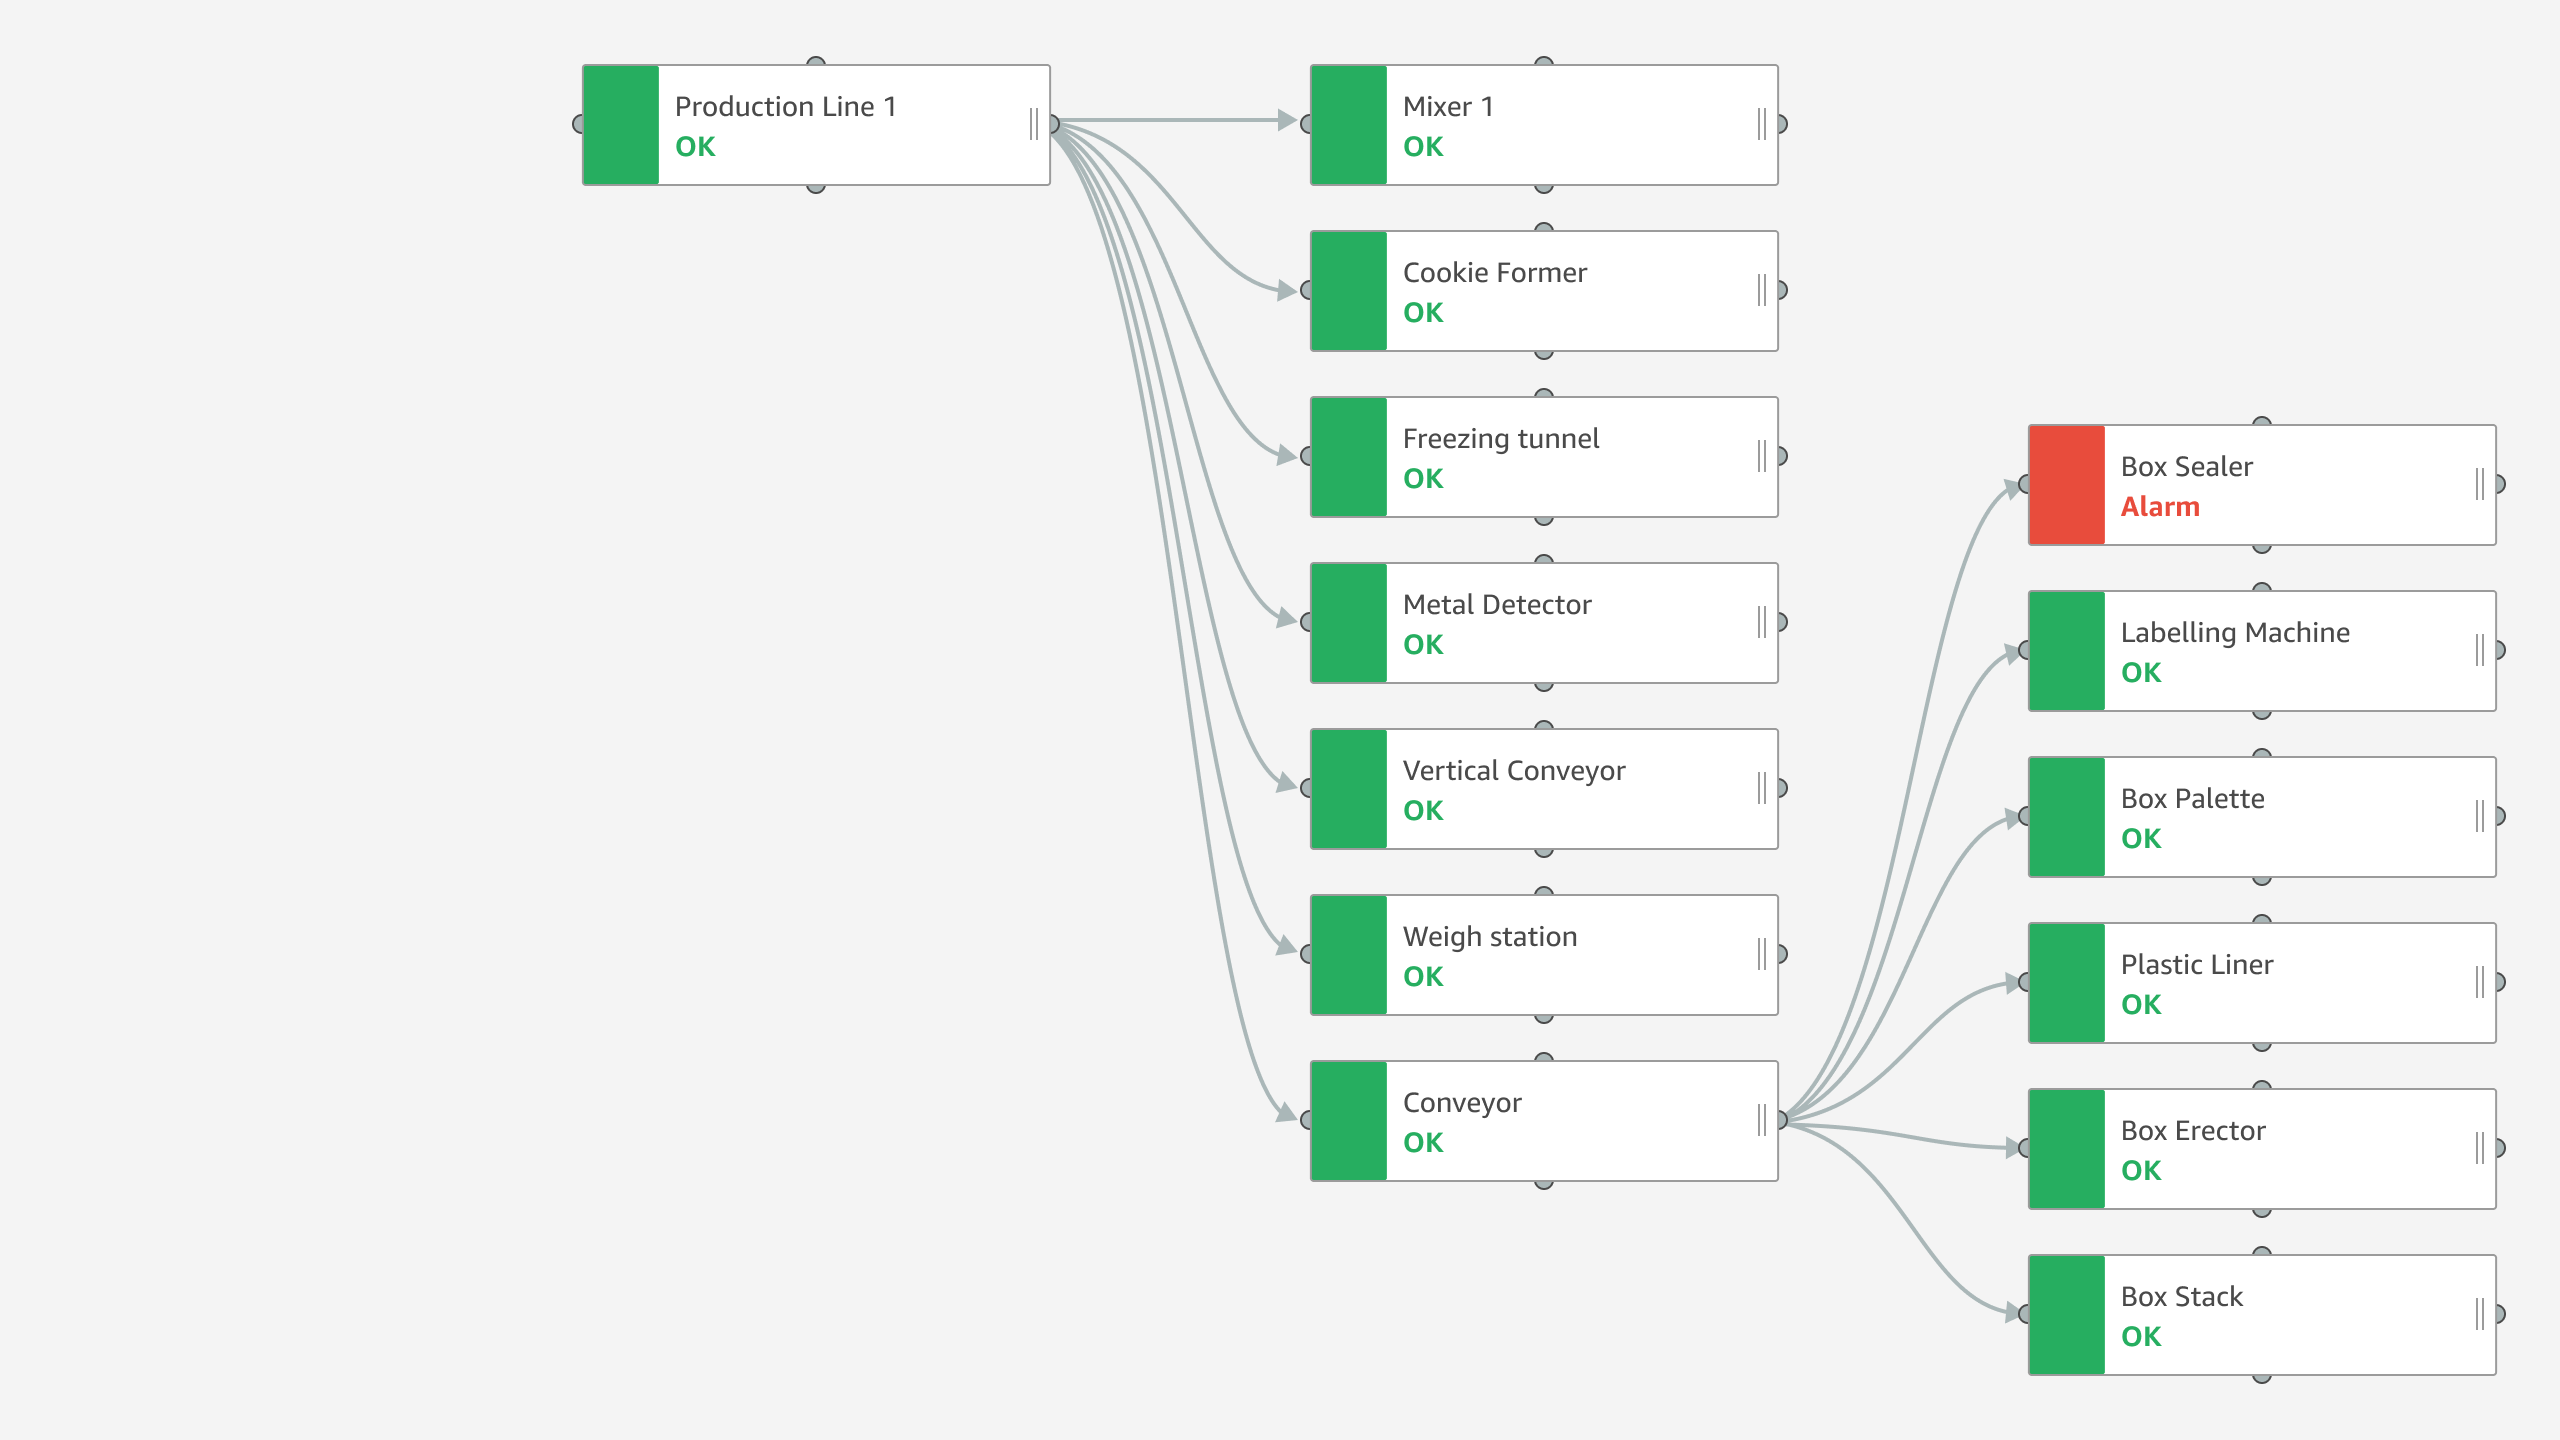
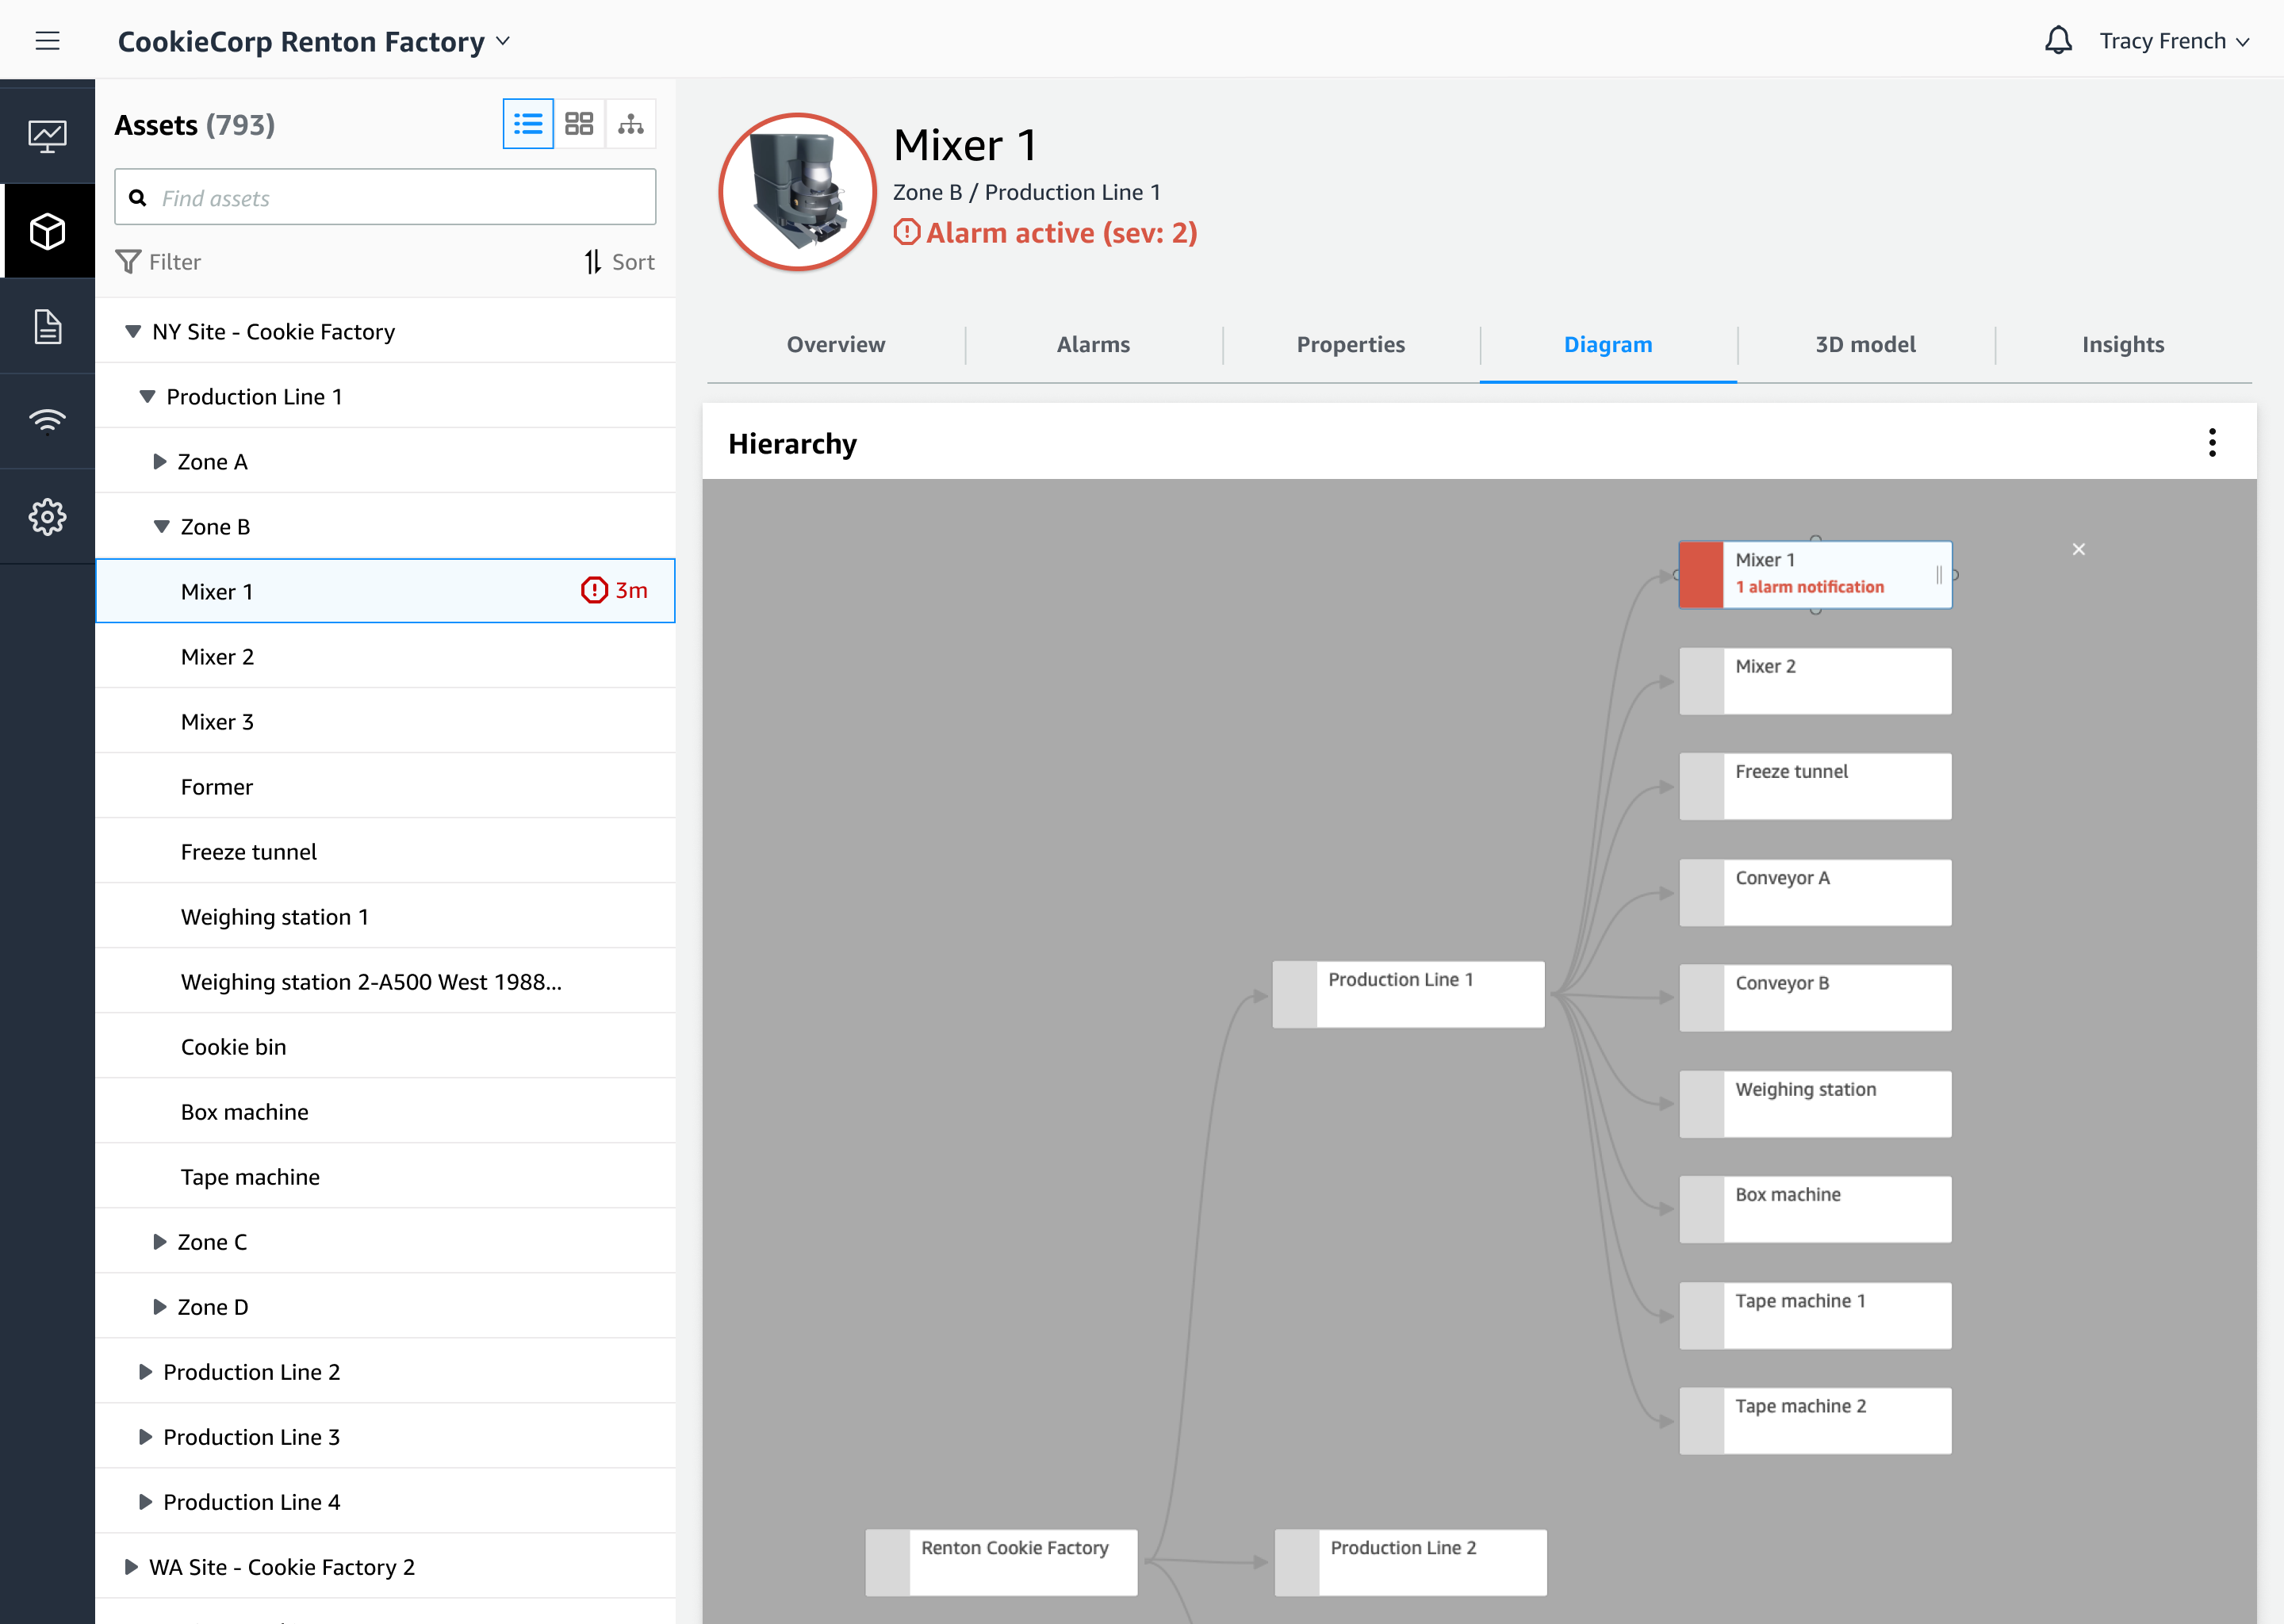
Flow Diagram
Monitoring, Root cause analysis
The next level up allowed visualization of the hierarchical relationships between assets.
Diagram maker is now available open source. the diagram maker.2D Process Diagram
Simulation, operations planning
Going up another level allows seeing how the machines spatially and sequentially work together in a typical production process.
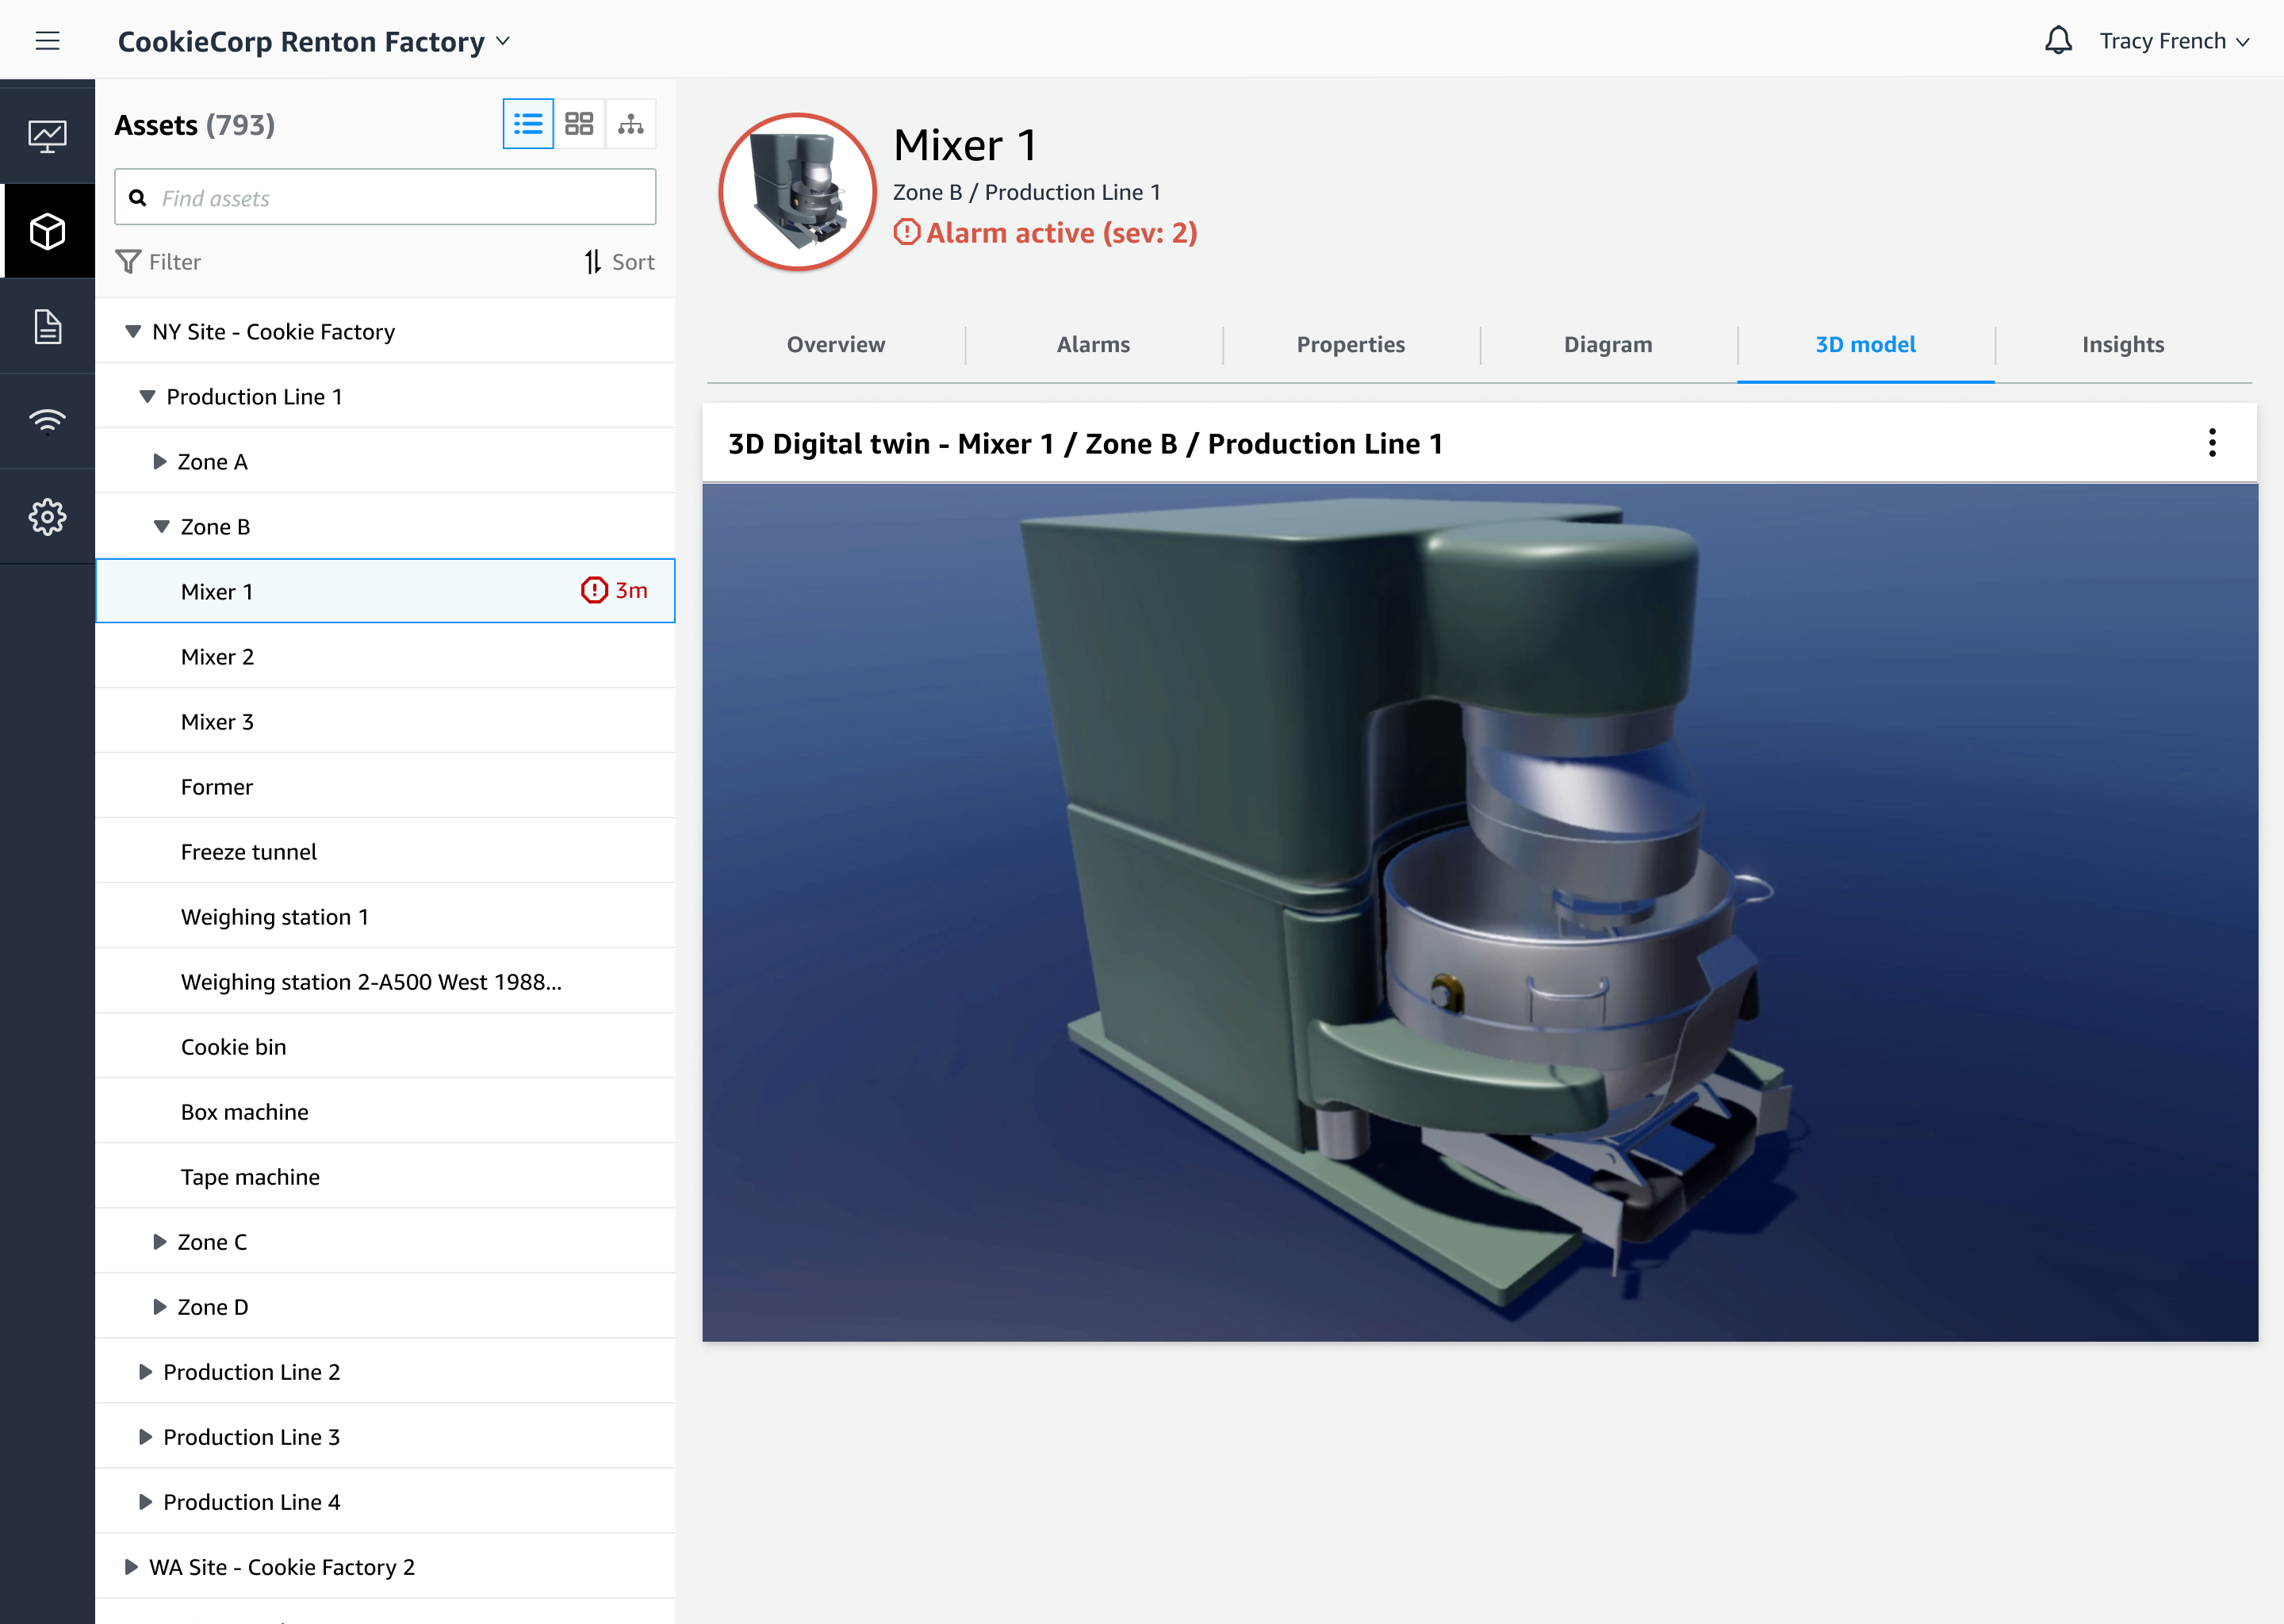
3D Digital Twins
Simulation, training
Finally, a fully blown digital twin serve as virtual replicas of physical devices that domain experts can use to run simulations before actual production runs are deployed.
3D rendering by Starr ShawWorking backwards
Design system
AWS had a design system that was meant to unify the console experience across 200+ services. However, this design system was meant for a heavy IT developer persona, and the patterns and priorities were not optimal for our OT persona. As such I extended the existing AWS design system and made some adjustments to create one of the first consumer applications that AWS would offer. This would later serve as a model for other enterprise and consumer applications.
Squarespace for Industrial IoT Application
We originally offered interpolation, but it turns out that operators were actually very confused by interpolation, because it meant that we were smoothing out data for them without their knowledge. The convenience was actually coming at the cost of trust in the system, they couldn't know for sure if our interpolating could make them miss a threshold breach, or which values were real and which were calculated.
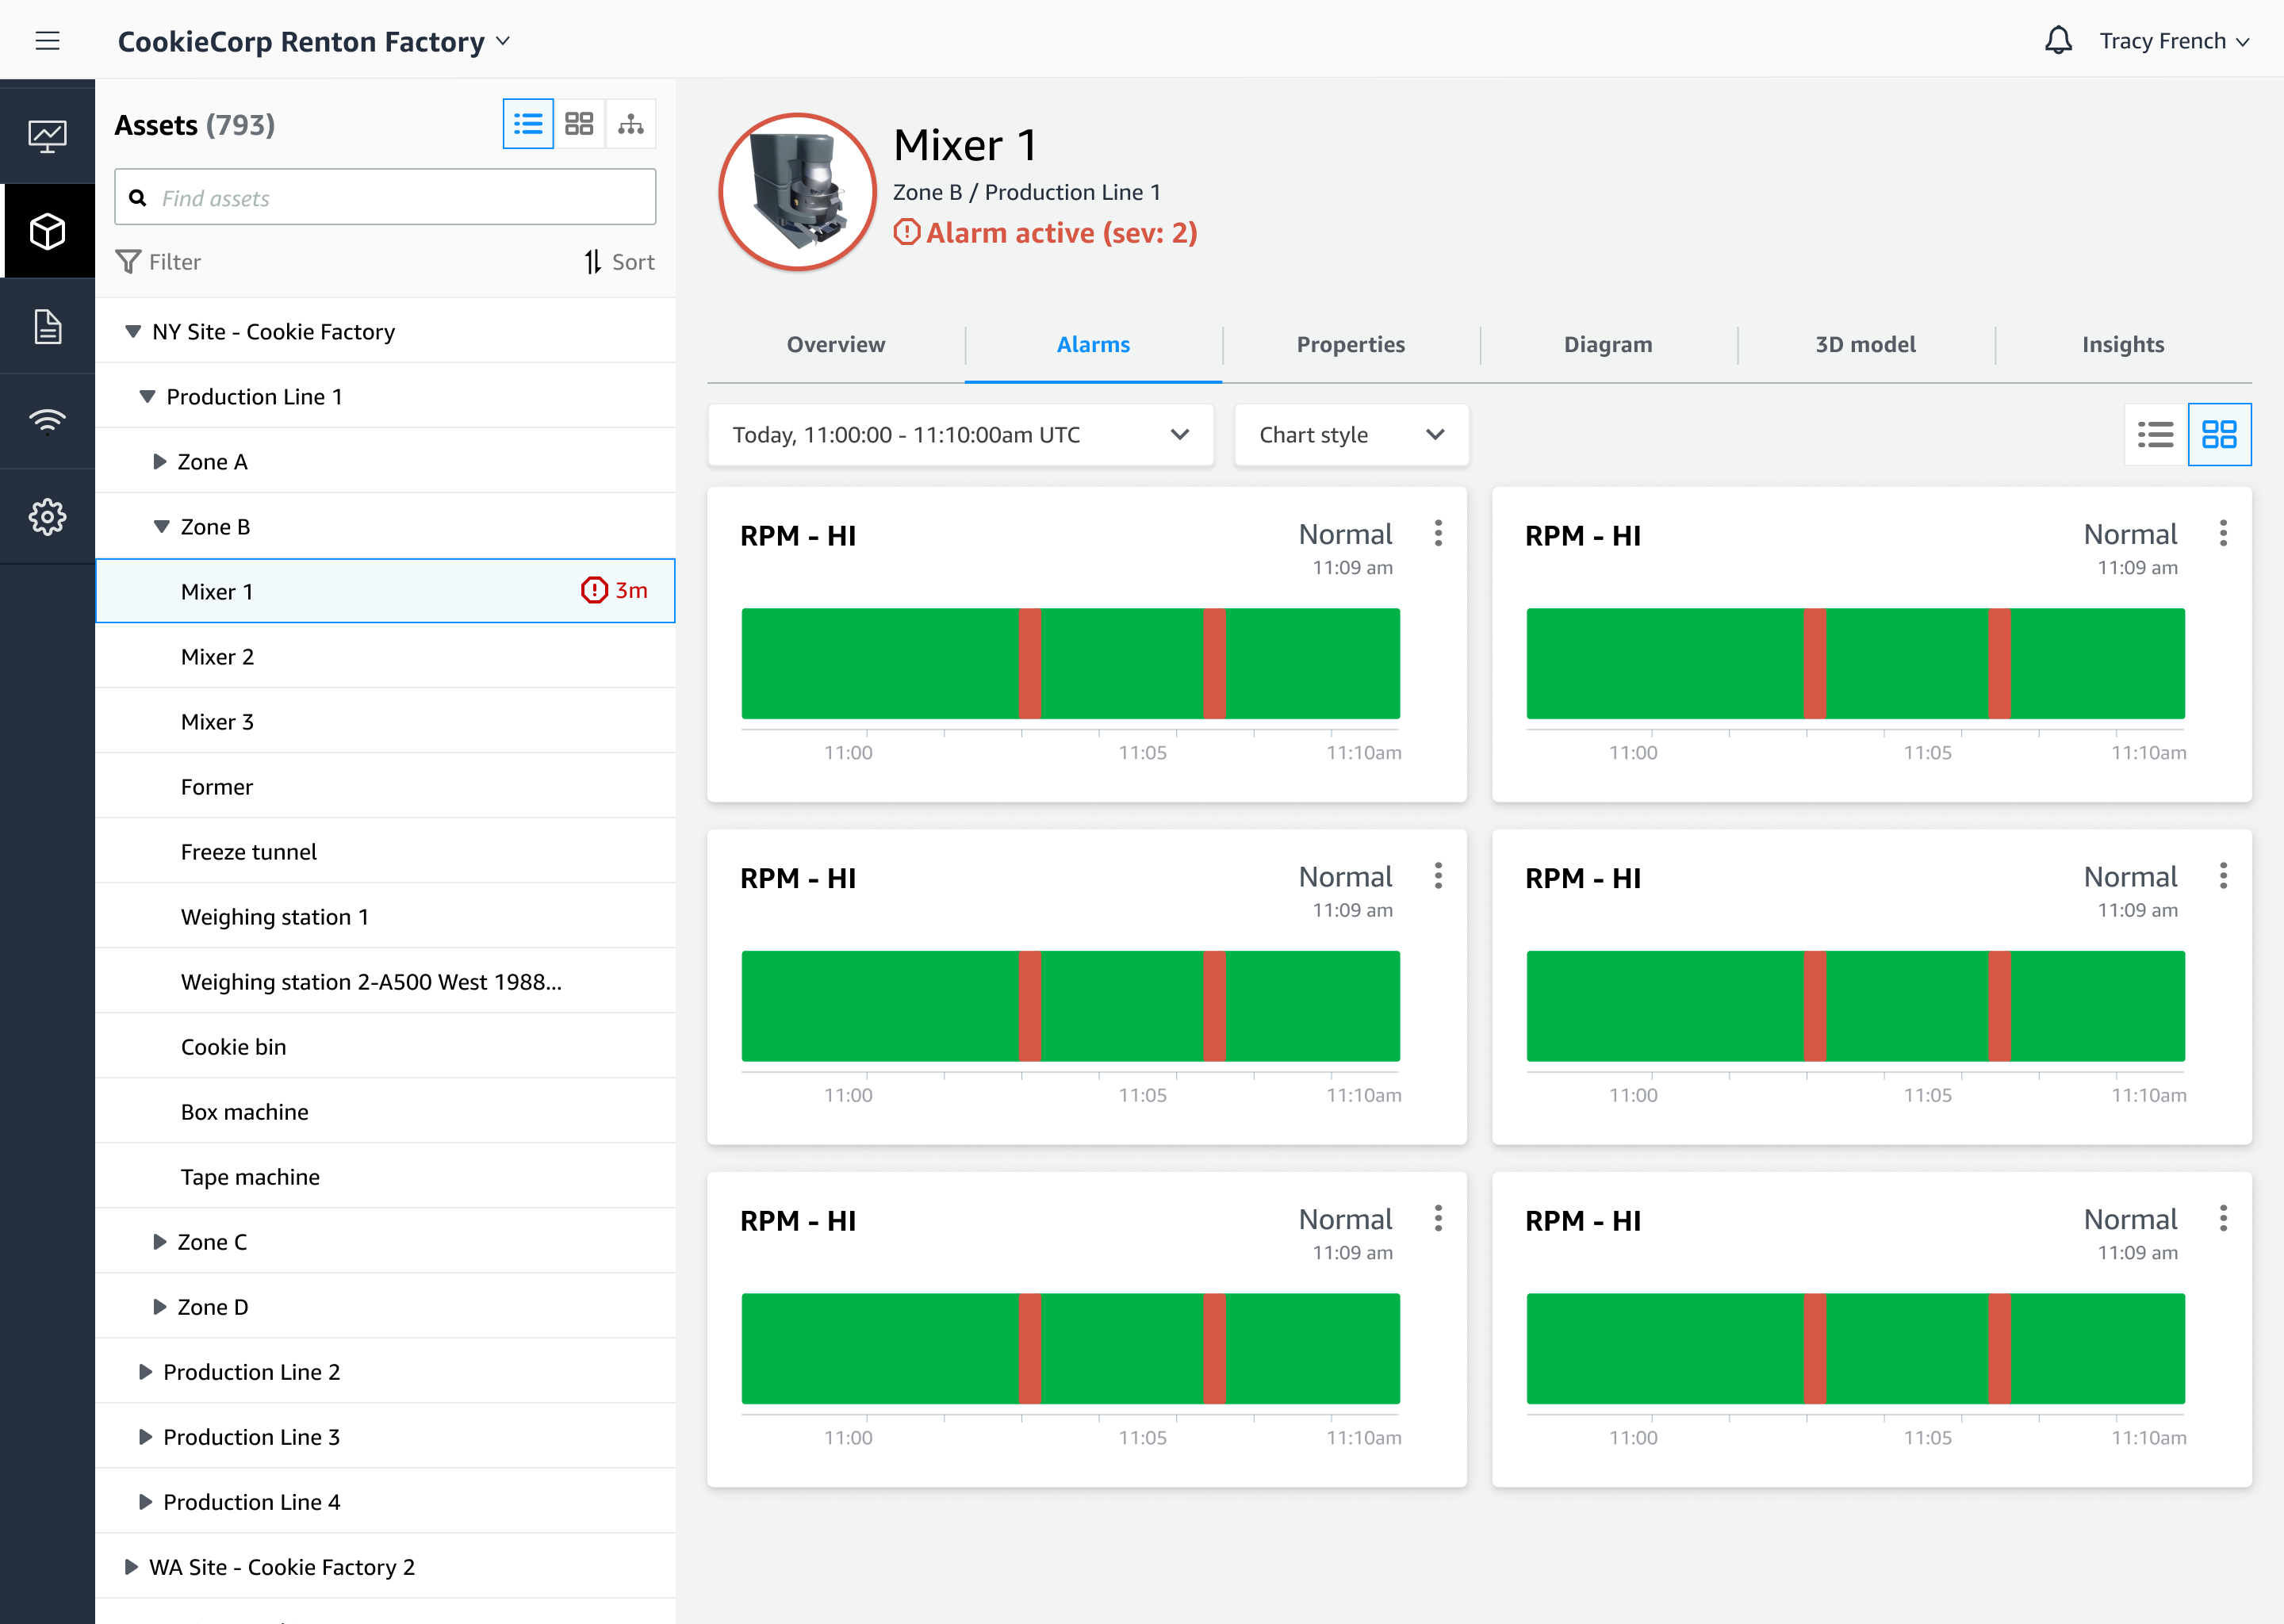
Monitor alarms
Status timelines visualizations for operators.
Analyze properties
Use different chart types, set thresholds, and view trend lines to perform root cause analysis to diagnose problems.
2D Process Diagrams
Understand the context of this machine in the entire process.
3D Digital Twin Models
Switching to 3D in context for specific use cases
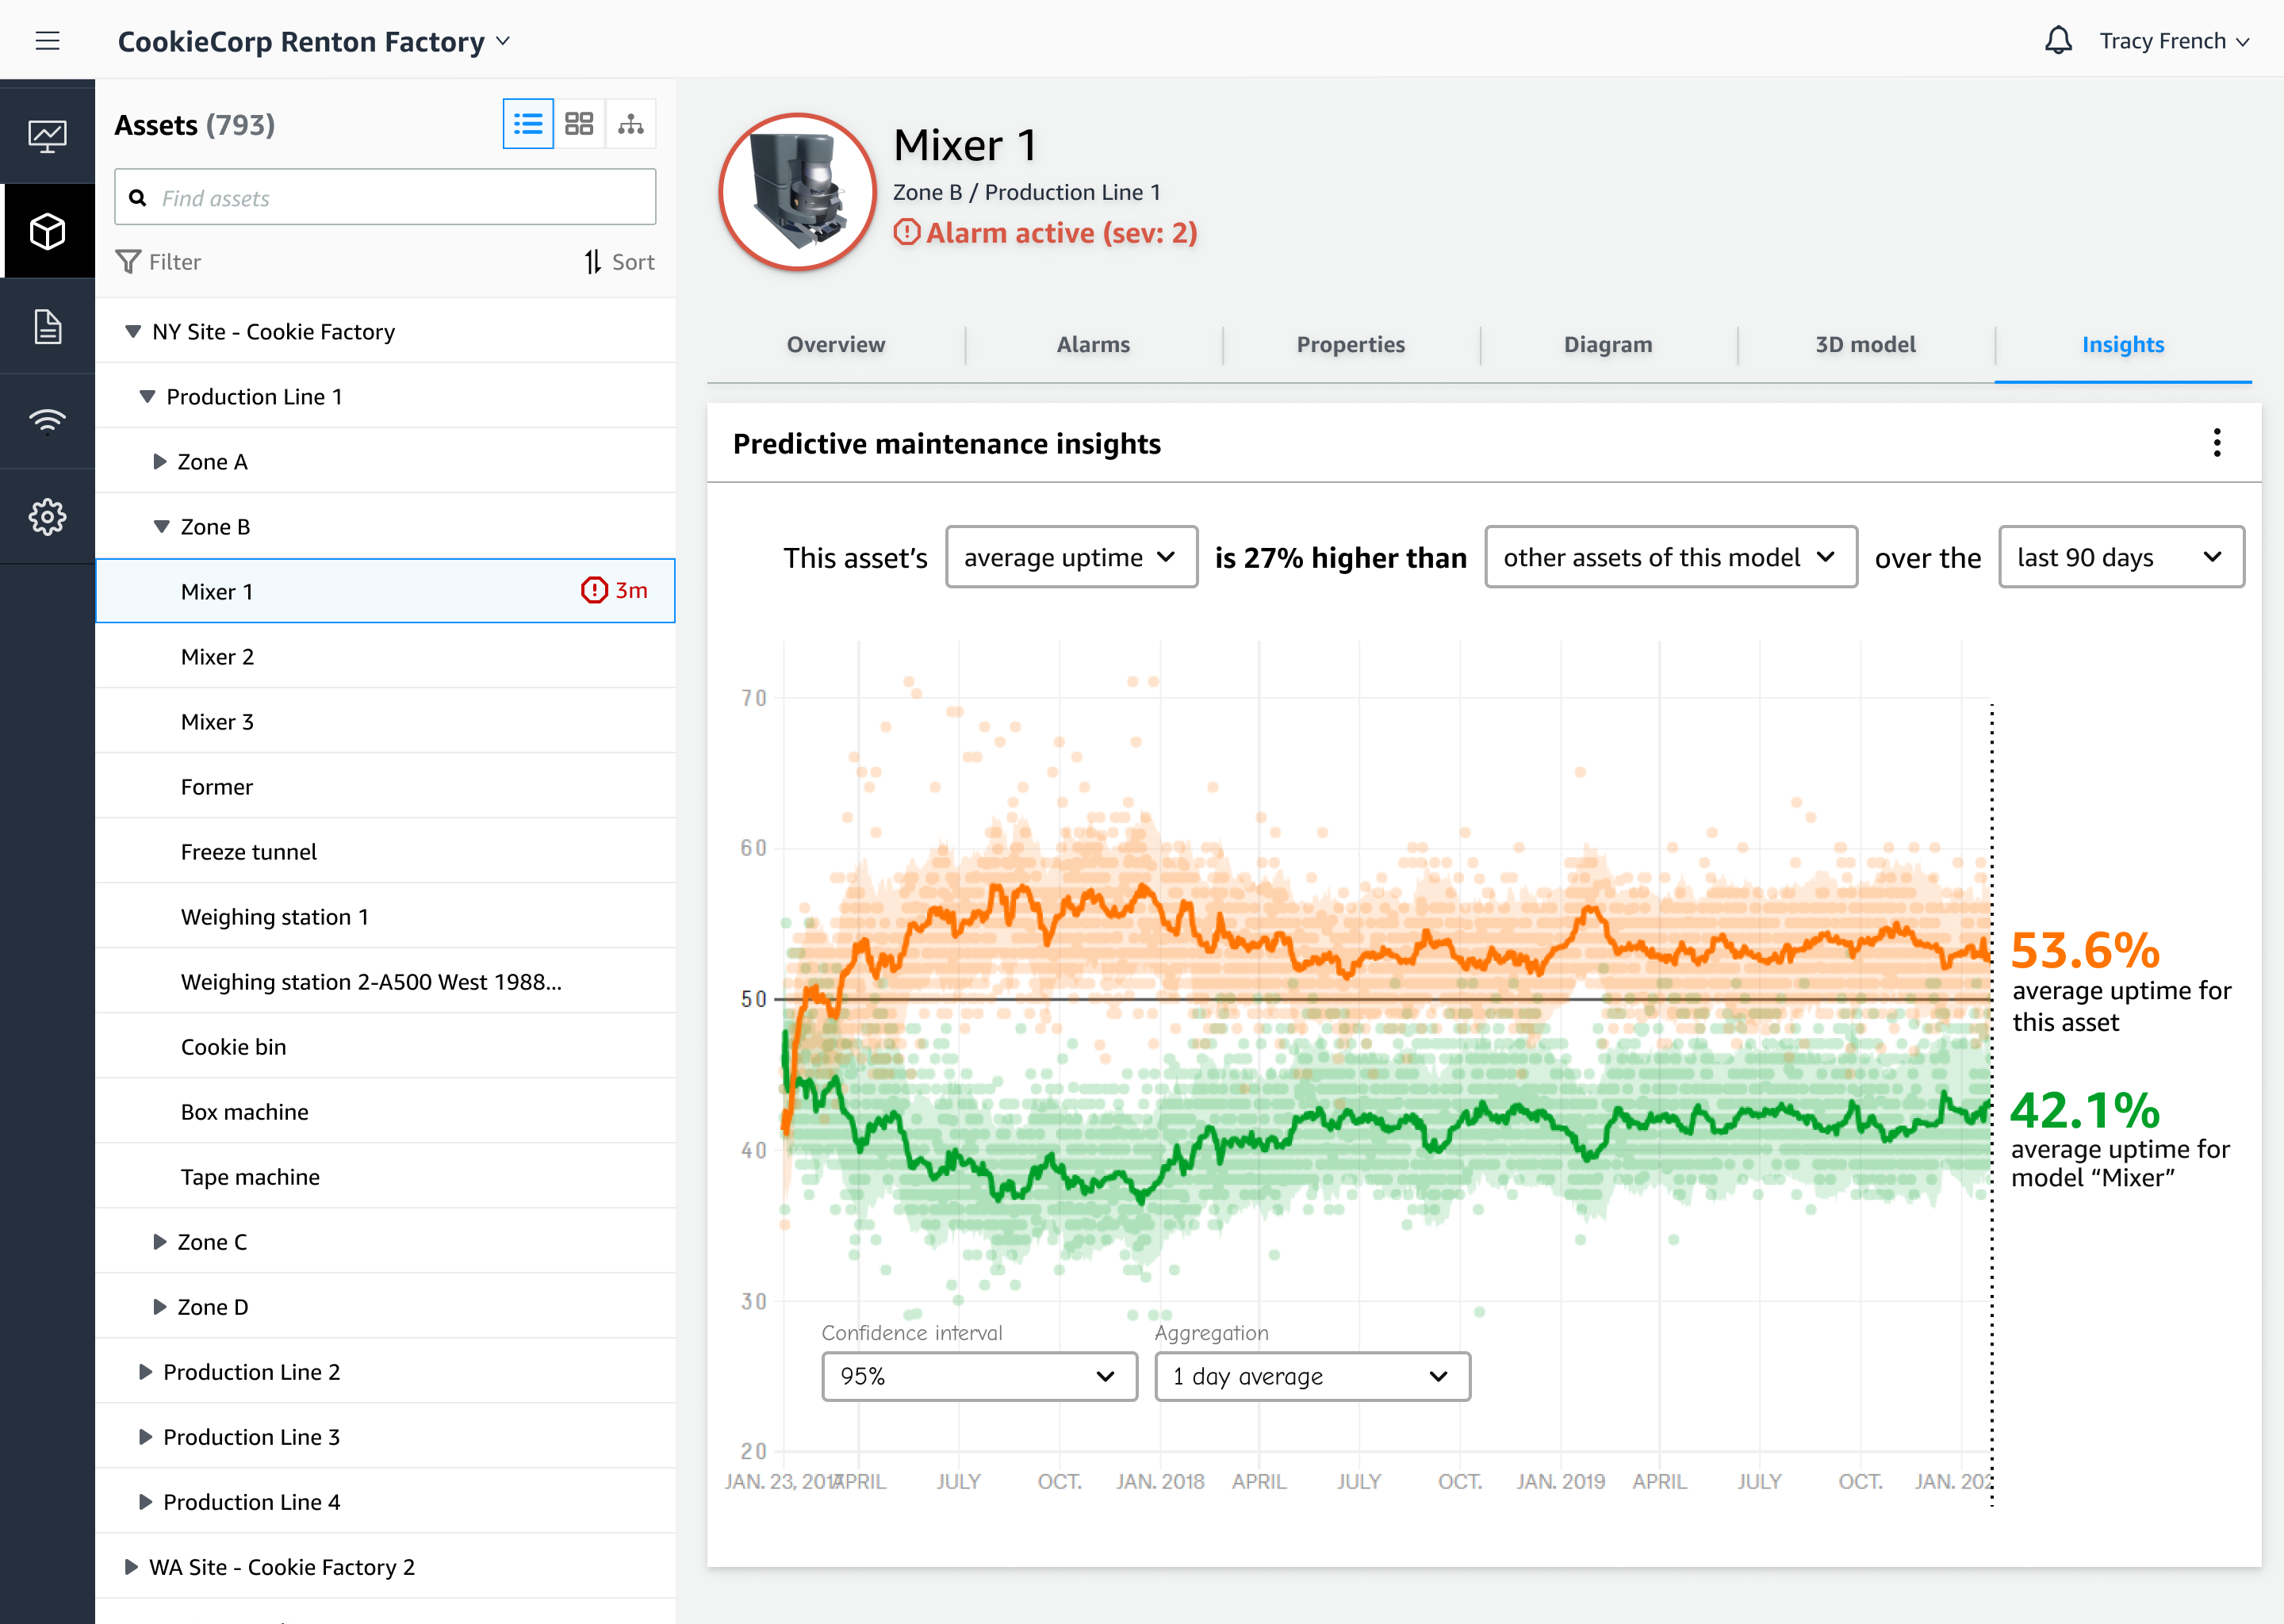
Predictive Insights
Integrate AWS machine learning and AI capabilities for industrial use case.